If a tree falls in the woods and no one is around, does it make a sound? Yes, it does. Just like if a log message is emitted but fails to process into your observability platform, that log message really did happen—and, assuming it’s something important, you’ll almost certainly hear about it eventually.
Elastic is built to adapt to all kinds of data your systems emit: logs, metrics, traces, custom telemetry, and more. But when that data doesn’t match the expected shape due to a schema change, a misconfigured agent, or a rogue service emitting unexpected fields, it can fail to process and silently disappear.
That absence is a signal. But it’s also hard to detect, hard to debug, and hard to report on. And worse, it puts the burden on the client to figure out what happened.
That’s why we built failure store: a new way to capture, debug, and analyze failed events directly in the Elastic Stack. In this blog, we’ll go over Elastic’s failure store and explain how it provides visibility into data ingestion issues, helps debug schema changes, and enables teams to monitor data quality and pinpoint failure patterns.
About failure store
Failure store gives you visibility into failed events that were previously only visible to the client sending the data and to dead letter queues. It works by capturing and indexing failed documents into dedicated `::failures` indices that live in your data stream alongside your production data. You can enable it per data stream or across multiple data streams with a single cluster setting.
Why it matters
Teams are often downstream from the source of truth. They don’t write the code; they just keep it all running. When upstream teams ship changes that break mappings or introduce unexpected fields, failures happen. But without access to the original failed data itself, debugging becomes guesswork.
Even worse, when data fails to be indexed, it doesn’t exist in your indexes—which means it’s much harder to measure the impact. You can’t track which streams are failing most often. You can’t quantify how broken your pipelines are. And you certainly can’t alert on what’s missing if the platform never saw it (except for alerts when data goes missing).
The failure store allows a developer to understand which data failed indexing and why, giving observability engineers the tools needed to quickly understand and fix ingestion failures. Triage also happens quickly since failures are stored in Elasticsearch, with no need to gather information from remote clients or shippers.
Get started
Set up for new data streams…
PUT _index_template/my-index-template
{
  "index_patterns": ["my-datastream-*"],
  "data_stream": { },
  "template": {
    "data_stream_options": {
      "failure_store": { // ✨
        "enabled": true
      }
    }
  }
}
…or enable for existing data streams
Enable failure store for individual data streams in stack management in Kibana or leverage the _data_stream API:
PUT _data_stream/my-existing-datastream/_options
{
  "failure_store": {
    "enabled": true
  }
}
Enable failure store via cluster setting
If you have a large number of existing data streams, you may want to enable their failure stores in one place. Instead of updating each of their options individually, set data_streams.failure_store.enabled to a list of index patterns in the cluster settings. Any data streams that match one of these patterns will operate with their failure store enabled.
PUT _cluster/settings
{
  "persistent" : {
    "data_streams.failure_store.enabled" : [ "my-datastream-*", "logs-*" ]
  }
}
A failing document response
After enabling the failure store, requests that previously would fail are now processed differently. The client now receives a 201 created instead of a 400 Bad Request. Especially if you’re using custom applications or our language clients, make sure to update your code accordingly. When a document goes to the failure store, the response will contain the failure_store: used attribute.
{
"_index": ".fs-logs-generic.otel-default-2025.07.31-000010",
"_id": "2K9IYpgBfukt97YIaUPG",
"_version": 1,
"result": "created",
"_shards": {
"total": 2,
"successful": 1,
"failed": 0
},
"_seq_no": 0,
"_primary_term": 1,
"failure_store": "used"
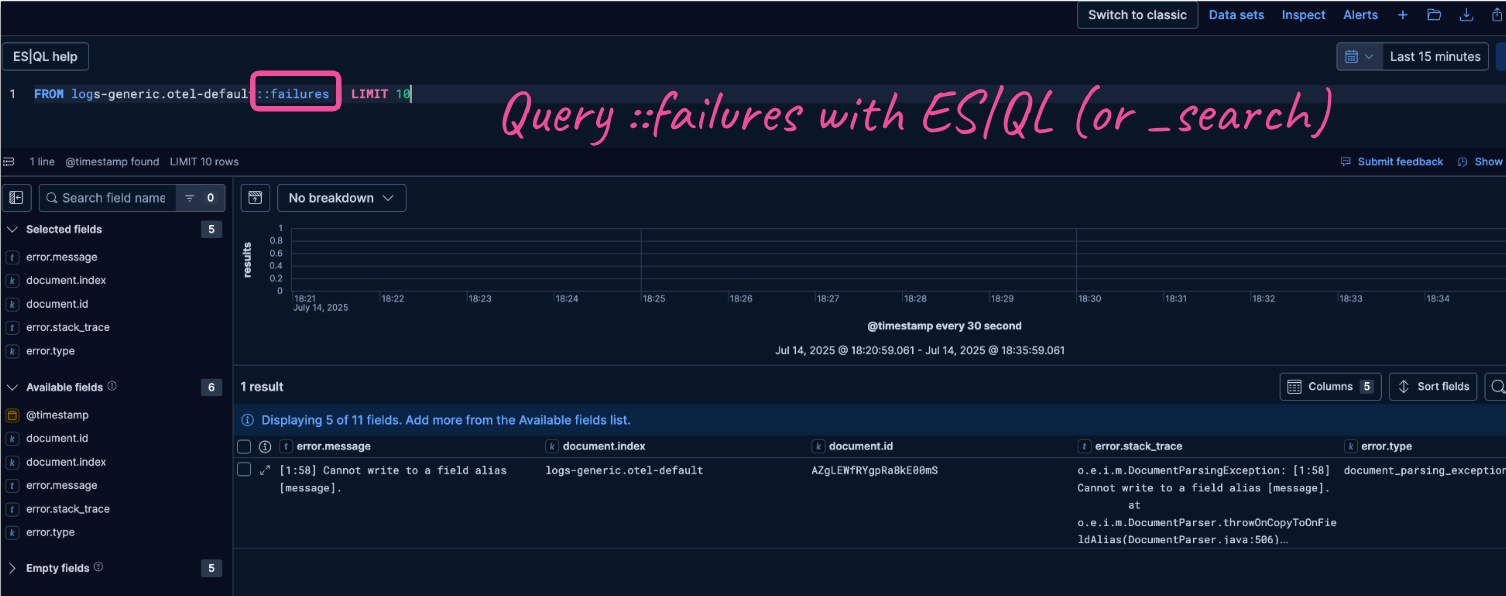
}Search and filter failure data just like any other logs, with support for ES|QL and Kibana tools:
FROM logs-generic.otel-default::failuresData in the failure store comes with all the context to make debugging simple. Each ::failures index contains information about which pipeline failed, along with specific error messages, stack traces, and error types that help you identify patterns.
Are you getting lots of errors and aren't sure where to start? Use ES|QL and ML functions. With the data exposed in ES|QL, errors can be analyzed with ML capabilities such as CATEGORIZE to help parse errors and extract patterns. Read more about data remediation techniques in our documentation.
Control costs and retention using the same data stream lifecycle you're already using for your other data. Absent a custom retention, failure store data will stick around for 30 days.
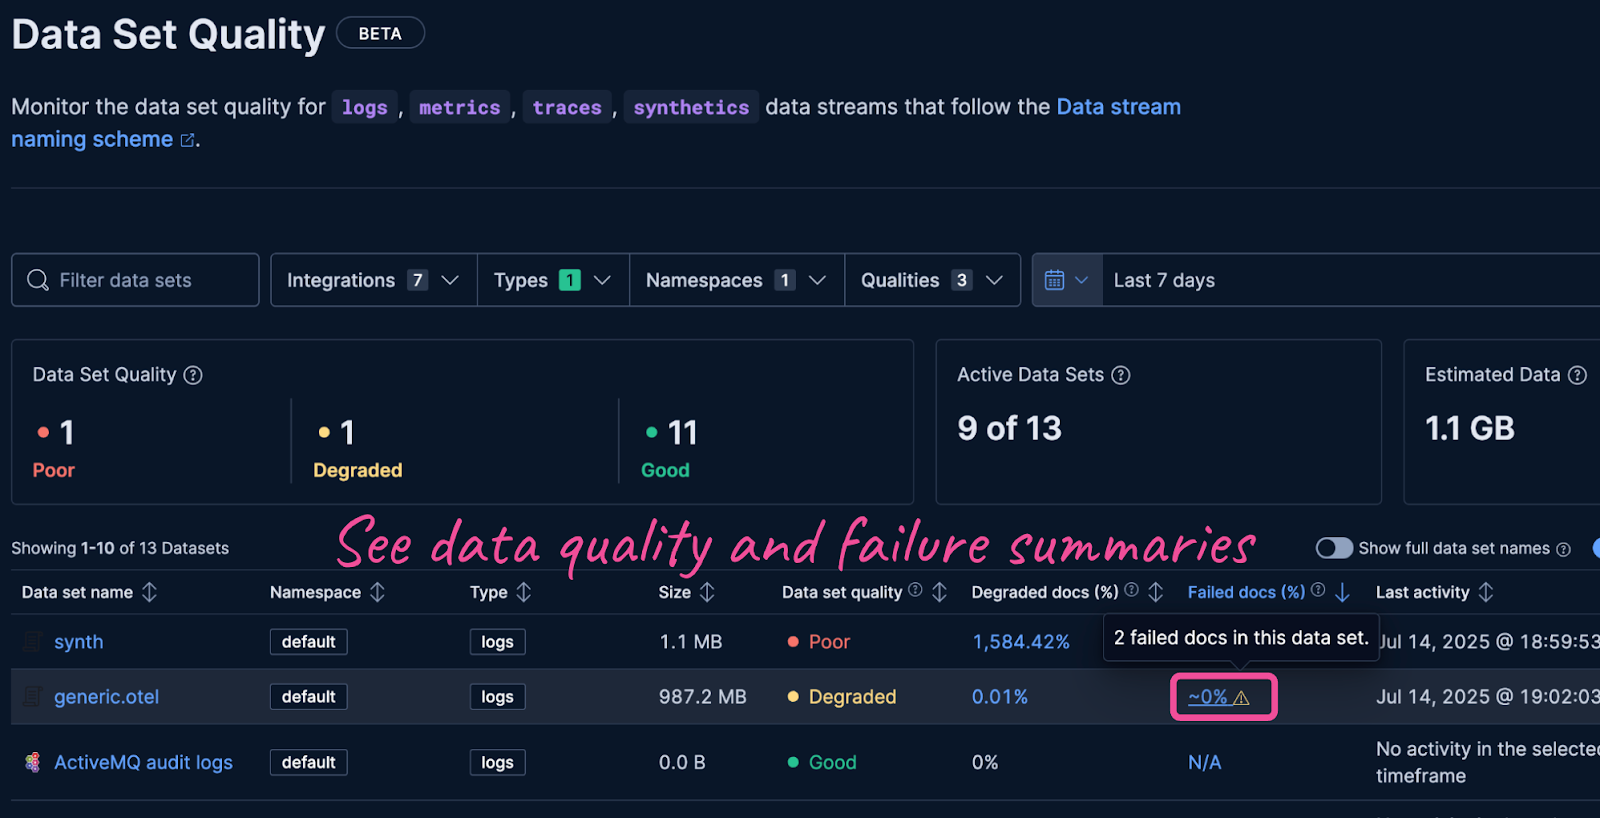
Monitor data quality over time with failure metrics and sortable dashboards by failure percentage to find new problem areas that require investigation. Read more about data quality monitoring in the documentation.
Learn more
Failure store is available starting in Elastic 9.1 and 8.19 and will be enabled by default on logs-*-* indexes in an upcoming release. To learn more, check the documentation for setup instructions and best practices.
Ready to try this out on your own? Start a free trial.
Want to get Elastic certified? Find out when the next Elasticsearch Engineer training is running!
Related content
May 12, 2026
Elasticsearch query logs: One coordinator-level line per query for ES|QL, DSL, SQL, and EQL
Easily understand query impact on cluster performance with Elasticsearch query logs. One coordinator-level line records ES|QL, DSL, SQL, and EQL per request and provides full query text, tracing, optional user context, and CCS hints
April 6, 2026
How to compare two Elasticsearch indices and find missing documents
Exploring approaches for comparing two Elasticsearch indices and finding missing documents.

Testing Elasticsearch. It just got simpler.
Explaining how Elasticsearch integration tests have become simpler thanks to improvements in Elasticsearch 9.x, the modern Java client, and Testcontainers 2.x.

December 19, 2025
Elasticsearch Serverless pricing demystified: VCUs and ECUs explained
Learn how Elasticsearch Serverless pricing works for Elastic’s fully-managed deployment offering. We explain VCUs (Search, Ingest, ML) and ECUs, detailing how consumption is based on actual allocated resources, workload complexity, and Search Power.
December 8, 2025
How excessive replica counts can degrade performance, and what to do about it
Learn about the impact of high replica counts in Elasticsearch, and how to ensure cluster stability by right-sizing your replicas.