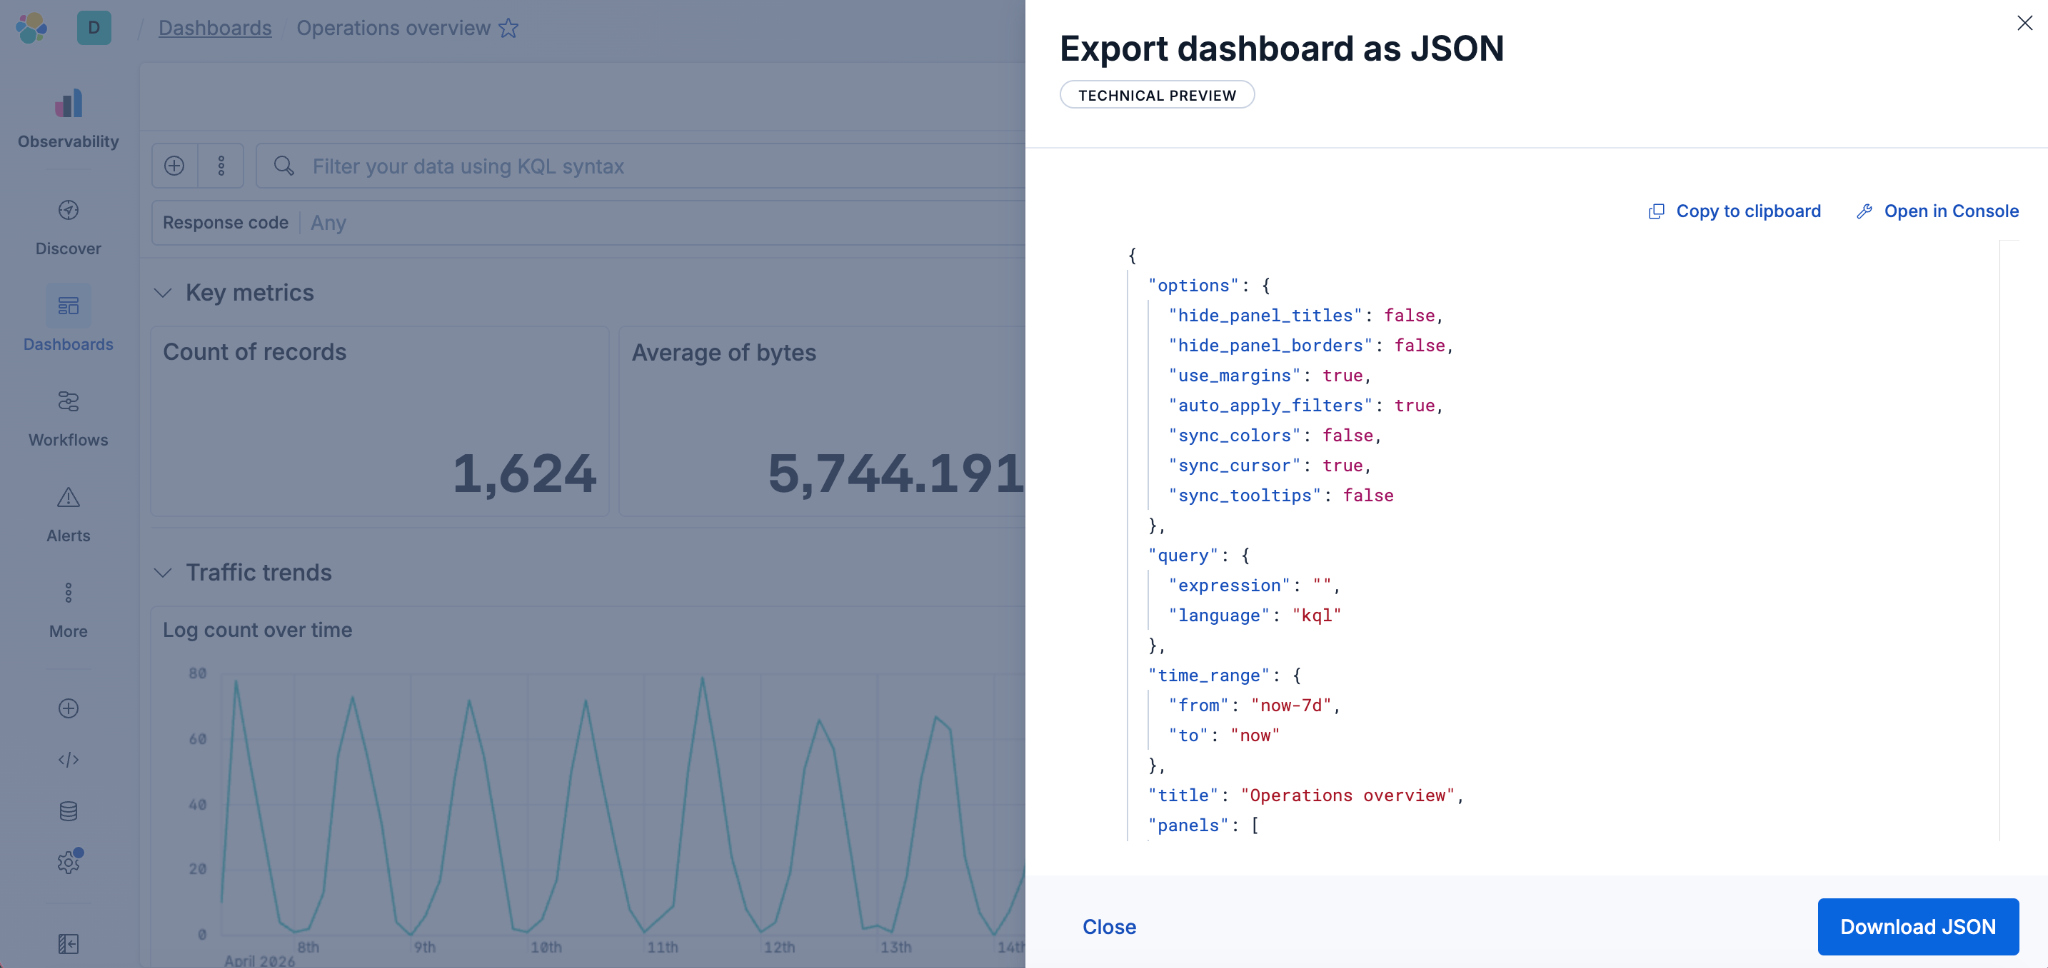
The Elastic AI Chat in Kibana now turns a plain-language question into ES|QL-backed visualizations or a full dashboard — right inside your conversation. Describe the metrics you need, refine as you go, and save when the story holds. Everything stays in the conversation until you're ready to save them, then becomes a first-class Kibana object your team can open, edit, and reuse. Available as a technical preview in Elastic 9.4
The agent builds dashboards from scratch, but it also works with what you already have. Open the AI Chat sidebar while viewing a dashboard and it attaches automatically. Ask why a metric spiked, break it down by region, or add a comparison panel. Your existing dashboard becomes the starting point, not just the end product.
Behind the scenes: How we built dashboards in the AI Chat
We teach the agent specific tasks through skills — structured descriptions of how to operate on a given problem. But building a dashboard skill meant teaching an LLM to generate valid Kibana dashboards, and the legacy Saved Object API made that painful: deeply nested JSON, subtle version-to-version changes, brittle references. We needed a different approach
A purpose-built API for programmatic dashboards
The new Dashboards API was built for exactly this scenario. Instead of exposing raw internal state, it offers typed, validated schemas for every panel type. The API handles the translation between clean external structures and Kibana’s internal representations, so the agent can focus on what the dashboard should contain rather than on how to format it.
One skill, one tool, many operations
The dashboard-management skill exposes a single manage_dashboard tool that accepts an ordered array of operations. Each operation is a discrete action: Set metadata, add a markdown panel, create ES|QL-backed visualizations from natural language, edit existing panels, group panels into collapsible sections, or reposition items on the grid.
The agent can describe an entire dashboard: title, description, sections, and every panel inside them in a single call:
{
 "operations": [
   { "operation": "set_metadata", "title": "Checkout latency investigation" },
   {
     "operation": "add_section",
     "title": "Overview",
     "panels": [
       { "query": "p95 checkout latency over the last 24h", "chartType": "xy" },
       { "query": "checkout error rate by region", "chartType": "metric" }
     ]
   }
 ]
}
Operations execute in order, so later steps can reference and build upon earlier ones. This design keeps the conversation focused on intent rather than on implementation details.
The visualization pipeline: Natural language to ES|QL to visualizations
When you ask for a dashboard, the agent explores your data — indices, field mappings, types — then plans the visualizations and calls manage_dashboard.
Each panel runs through its own pipeline: chart type selection, ES|QL generation, visualization configuration, and validation. We isolated this from the main agent thread — visualization construction takes several model calls per panel, and mixing it into the main context would bloat the window and muddy the reasoning.
Inside manage_dashboard, all panels build concurrently, then reassemble in order. The result is a complete dashboard with embedded panels — no orphaned visualizations, no sync issues.
Why we moved visualization creation inside the dashboard tool
Our first approach used a separate create_visualization tool — one call per panel, then hand each attachment to the dashboard tool. It worked, but every visualization needed its own tool call, its own lifecycle, and an explicit handoff. Worse, editing a visualization in the conversation didn't update the dashboard panel, which confused users.
We folded visualization creation directly into manage_dashboard. The same parallel workflows run, but panels assemble into the dashboard structure without intermediate attachments. Fewer calls, no sync issues, one lifecycle.
Standalone visualizations still work — you can drop existing charts into a dashboard via attachment references — but for building from scratch, inline creation is the cleaner path
For security teams
SOC analysts and detection engineers can't afford a round trip to the dashboard editor mid-investigation. With the AI Chat, ask for alert volume by rule type, host, or MITRE tactic and see it in your thread in about a minute. As the hunt develops, layer in panels — process execution anomalies, network connections, timeline comparisons — without breaking context.
Save when you're done. The dashboard becomes a reference for the post-incident review, a starting point for the next analyst, or a weekly threat briefing — no re-explanation needed.
Read more about how security teams can use dashboard creation and other recently launched AI Chat capabilities in this blog post.
For observability and site reliability engineers (SREs)
When a service degrades at 2 a.m., there's no time to build dashboards from scratch. With the AI Chat, an SRE can describe the metrics they need (p99 latency by service, error rate against deployment events, pod restarts over the last hour) and get a full dashboard in the investigation thread in about a minute. The agent can refine it step by step as the picture sharpens: Add a panel, change the time window, break down by region.
Save the dashboard, and it's immediately available in the war room (same panels, same framing) for everyone joining the incident bridge. After the incident, it becomes the foundation for the postmortem.
What’s next
We're working on token optimization, richer full-screen interactions, broader panel support, and continued quality improvements. Technical preview is the right time to shape priorities — if something is missing, tell us via the "Submit feedback" icon in the top menu.
![Dashboard management page showing a list with one entry titled “[OTel] Host Details – Overview,” alongside filters, a search bar, a “Create dashboard” button, and an option to submit feedback.](https://cdn.sanity.io/images/me0ej585/search-labs-import-testing/1bb71a01a12641961134f2231778344a6249e8f4-1490x634.png?fit=max&auto=format)
Try it
Upgrade to Elastic 9.4 (or start a trial), open the AI Chat in full-screen mode, and try it on a real investigation. Ask the agent to chart the metrics you're looking at, then ask for the next breakdown. When the story holds, save and share — same panels, same framing, no re-explanation needed. Requires an enterprise license (get started).
The release and timing of any features or functionality described in this post remain at Elastic's sole discretion. Any features or functionality not currently available may not be delivered on time or at all.
Ready to try this out on your own? Start a free trial.
Want to get Elastic certified? Find out when the next Elasticsearch Engineer training is running!
Related content
May 26, 2026
Kibana dashboards as code: GitOps, drift detection and Terraform for Kibana dashboards in Elastic 9.4
Elastic 9.4 ships a typed Dashboards API and a native Terraform resource that bring drift detection, PR-reviewable diffs and git-based rollback to Kibana dashboards for the first time.
May 22, 2026
Kibana cuts dashboard load time by up to 25% - here's the polling strategy behind it
Find out how Kibana uses continuous polling and browser-side HTTP/2 detection to cut dashboard load times by up to 25%, with automatic fallback on HTTP/1.
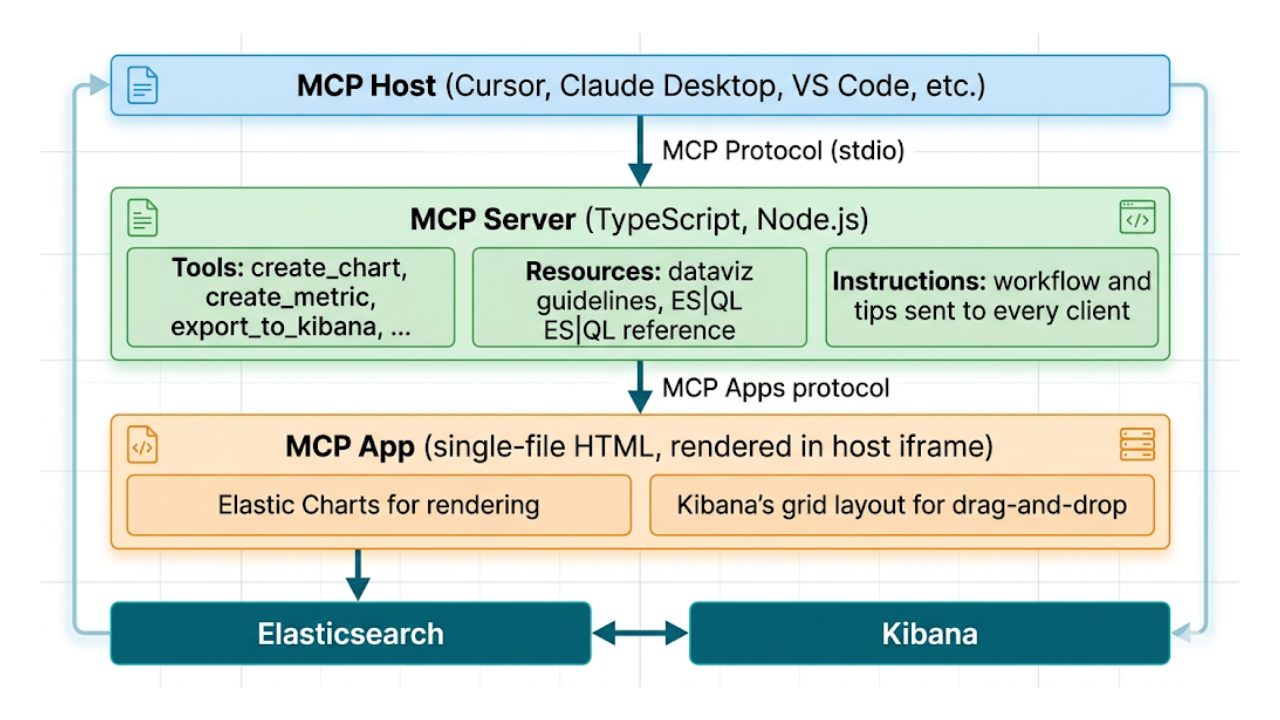
Describe it, don't draw it: AI-native Kibana dashboards via MCP and ES|QL
From prompt to dashboard. Learn how to build Kibana dashboards with natural language, using example-mcp-dashbuilder: an open source MCP application that writes ES|QL queries, creates interactive charts and exports fully functional dashboards directly to Kibana.

May 8, 2026
What’s new in Kibana Dashboards: flexible controls, improved defaults and a visual refresh
Kibana 9.4 ships a batch of dashboard improvements — from better defaults to layout controls to a visual refresh. Here's what changed and why.

April 28, 2026
Stop guessing which query is burning your cluster: Query activity in Kibana
Pinpoint long-running Elasticsearch searches from Kibana: live tasks, origin context, and cancel when the cluster allows without living in low-level APIs.