Kibana dashboards and Discover now load up to 25% faster thanks to continuous polling. Instead of sleeping between periodic checks, Kibana now keeps HTTP connections open and delivers Elasticsearch query results the moment they're ready. On HTTP/2+ (the Kibana default since 9.0) this kicks in automatically with no configuration required. On HTTP/1, Kibana falls back to traditional polling to prevent connection pool exhaustion.
How Kibana fetches data when loading a dashboard
When a Dashboard is opened, most of the panels (internally, we call these embeddables) kick off one or more Elasticsearch queries. But instead of the simple call-and-response of a synchronous (sync) search, we use the power of asynchronous (async) search (docs).
With async search, query results are kept available in Elasticsearch outside of any particular HTTP request. This is important because it
- makes data loading resilient to network turbulence
- powers our background search feature which allows users to work on other things in Kibana while they wait for a long-running dashboard or Discover session
After the initial query is submitted, Kibana monitors the search to detect when it is complete and retrieve the result set.
How traditional polling affects Kibana dashboard load times
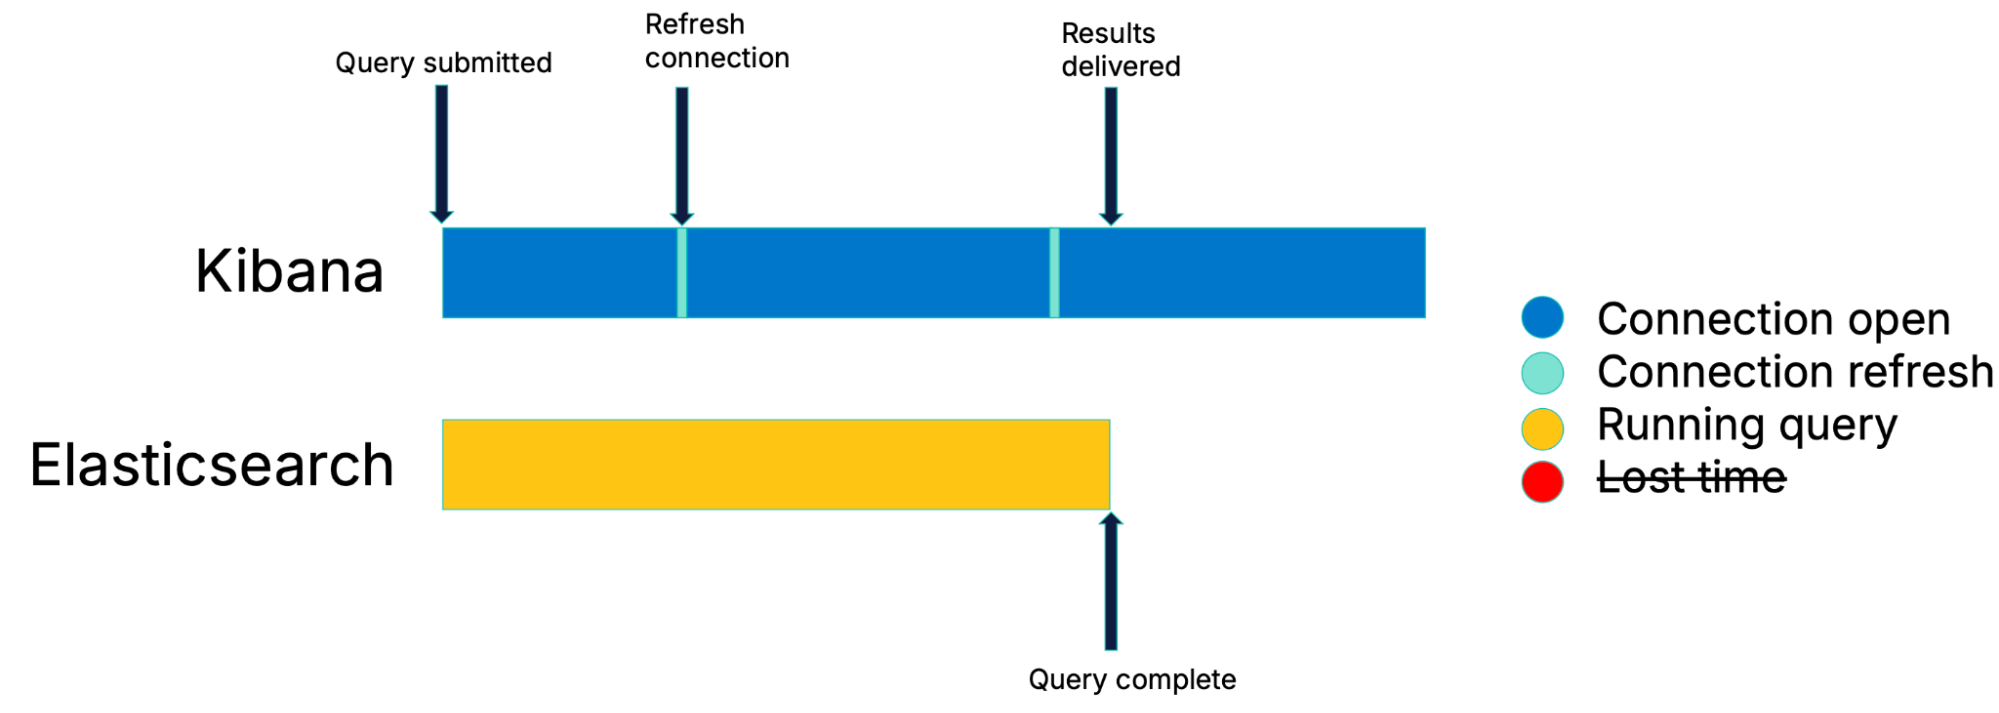
In traditional polling, Kibana submits a query, closes the initial connection, then periodically checks Elasticsearch for completion.
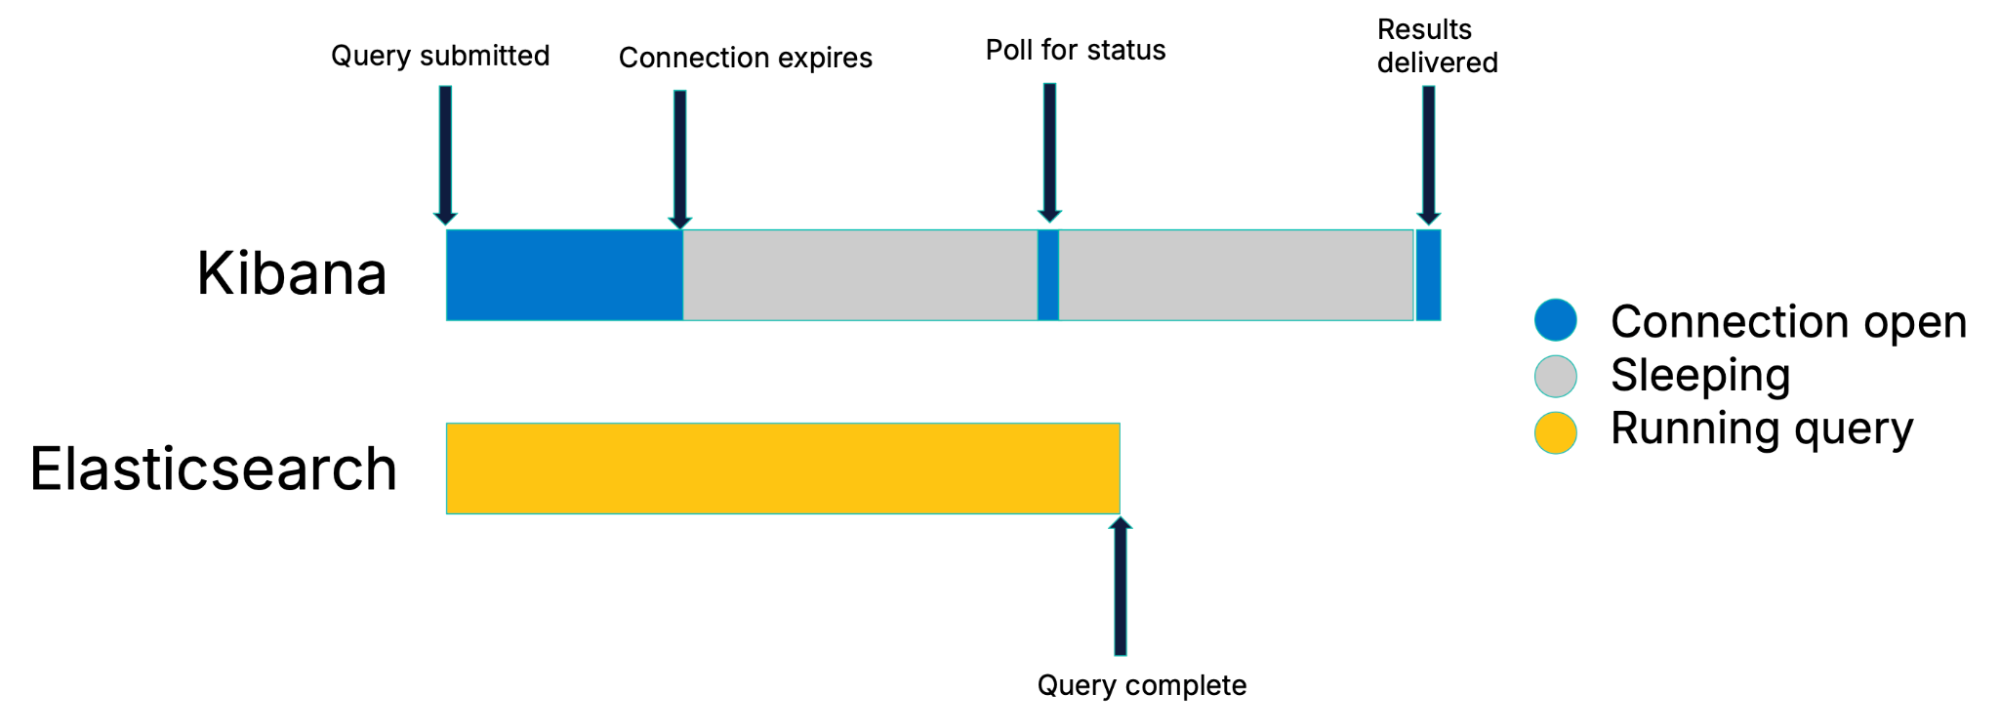
Traditional polling strategy
We do give Elasticsearch a short amount of time after query submission to simply complete the search and return results. If the search completes that quickly, it amounts to a simple call-and-response. But for longer searches, the initial connection is closed and Kibana begins periodically checking the search for completion. This is called polling.
Performance drawbacks of traditional polling
Looking at the figure above, perhaps you can already see the performance drawback to this approach: the search is most likely to finish during one of Kibana’s sleep intervals, leading to lost time.
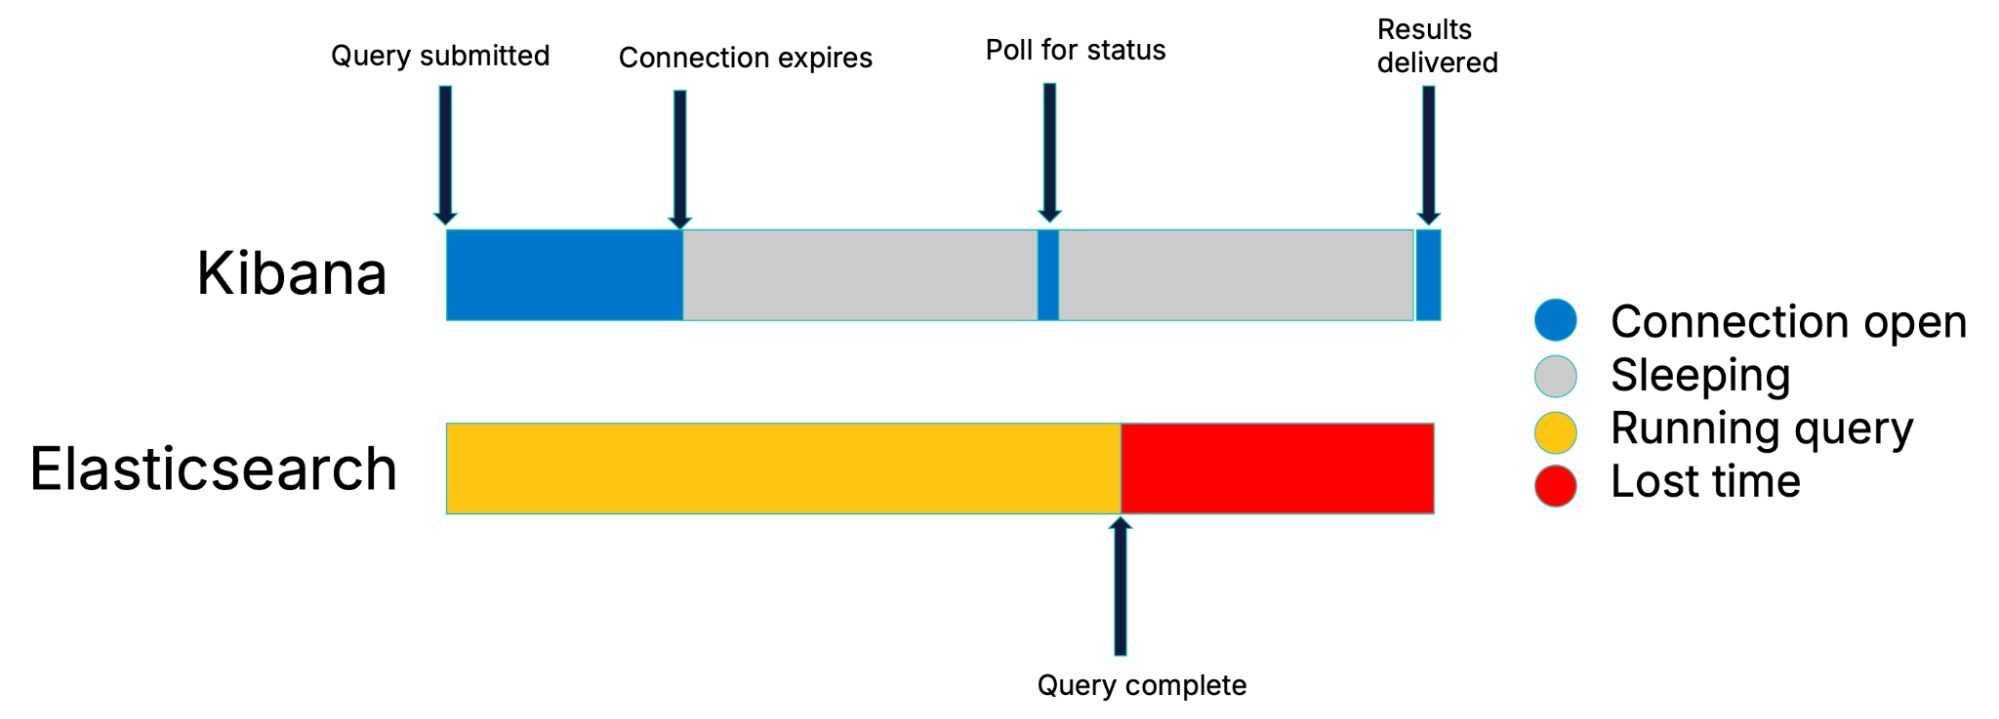
The dark side of traditional polling
In the worst case scenario (when a search completes at the beginning of a sleep period) the entire duration of the polling interval will be wasted.
The impact of a backoff strategy
It’s standard practice when polling to apply a backoff strategy. This means that the longer the duration of the search, the less frequently we poll.
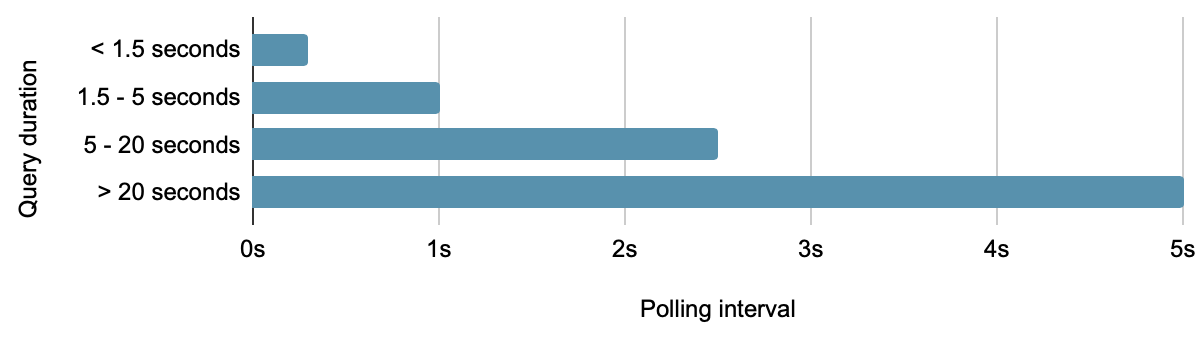
Poll interval backoff schedule
However, this also means that the potential lost time scales with the duration of the search.
How polling intervals create sawtooth latency patterns
Putting these factors together, our lost time becomes a stepwise sawtooth function.
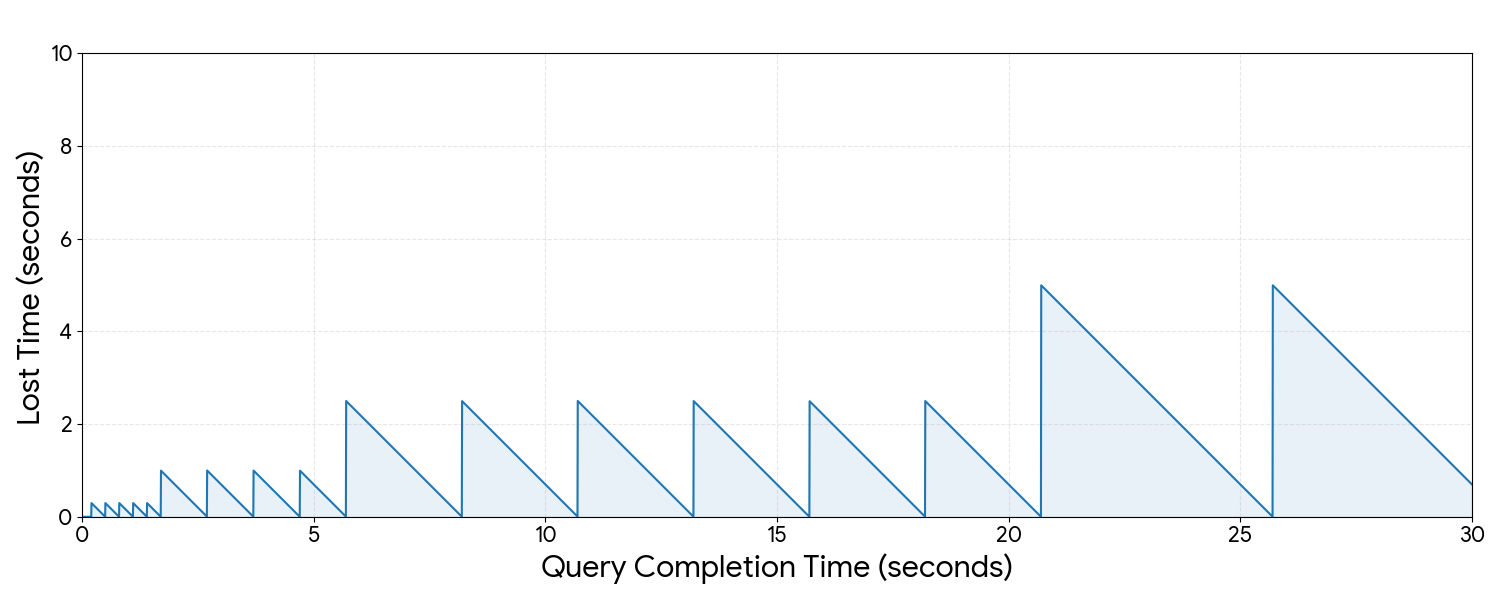
Time lost by query duration
Here, the peaks are worst-case scenarios and the troughs are best case scenarios. This illustrates that traditional polling costs us between nothing and the full duration of the polling interval, depending on the search duration (and network conditions).
Continuous polling: how Kibana eliminates wait time
The problem with traditional polling is a fundamental lack of coordination between Kibana and Elasticsearch. Ideally, Kibana knows immediately when results are available. So, what if we inverted the polling pattern to where nearly all of the time is spent checking Elasticsearch and no time is spent sleeping?
Continuous polling: a solution to lost time
With this combination of long polling and no more sleep periods, results are delivered as soon as they are ready.
HTTP/1 degradation
The theory is solid. So why does this Kibana deployment look so degraded when we turn on continuous polling?
Continuous polling causes a performance degradation on clients connected via HTTP/1
The key is that this deployment is running over HTTP/1. In HTTP/1, HTTP requests are mapped 1:1 to TCP connections. So several long-lived polling requests are hogging the browser’s finite connection pool, causing other requests to be queued.
In HTTP/2+ on the other hand, network requests can share TCP connections via multiplexing, so we don’t run into this problem.
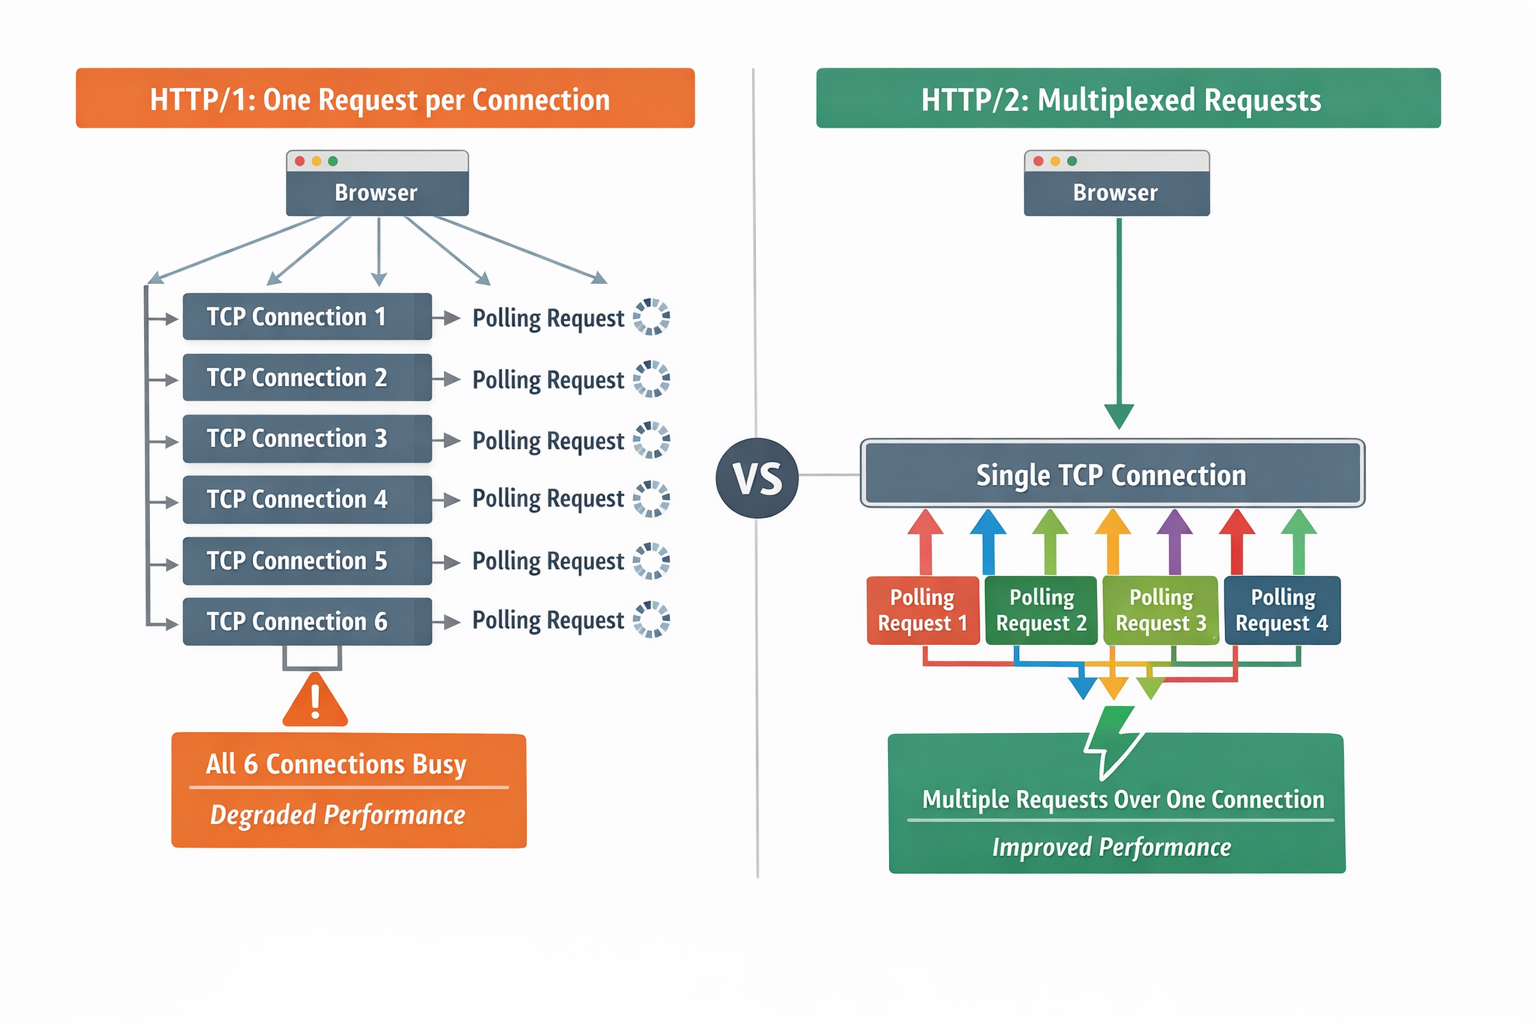
Difference in HTTP-TCP mapping between HTTP/1 and HTTP/2+
So, on HTTP/2+ continuous polling is a virtue but on HTTP/1 it becomes a vice.
| HTTP/1 | HTTP/2+ | |
|---|---|---|
| TCP connections | One per HTTP request | Multiplexed (many requests share connections) |
| Continuous polling behaviour | Degrades performance (connection pool exhaustion) | Full benefit (results delivered immediately) |
How Kibana detects HTTP protocol for optimal polling
HTTP/2 is the recommended protocol and it’s the Kibana default since 9.0, so it would be a shame not to ship this performance enhancement. On the other hand, the HTTP/1 experience is so degraded that it isn’t acceptable to risk it on any on-prem deployments who haven’t yet upgraded their protocol. The answer is clear: we need to detect which protocol is in use and apply the optimal polling strategy.
It is certainly possible for the Kibana server to know which protocol it is speaking. But, there’s a catch: the limiting factor is the browser’s connection pool. That means that what really matters is what the browser is speaking.
Because of proxies, these are not always the same.
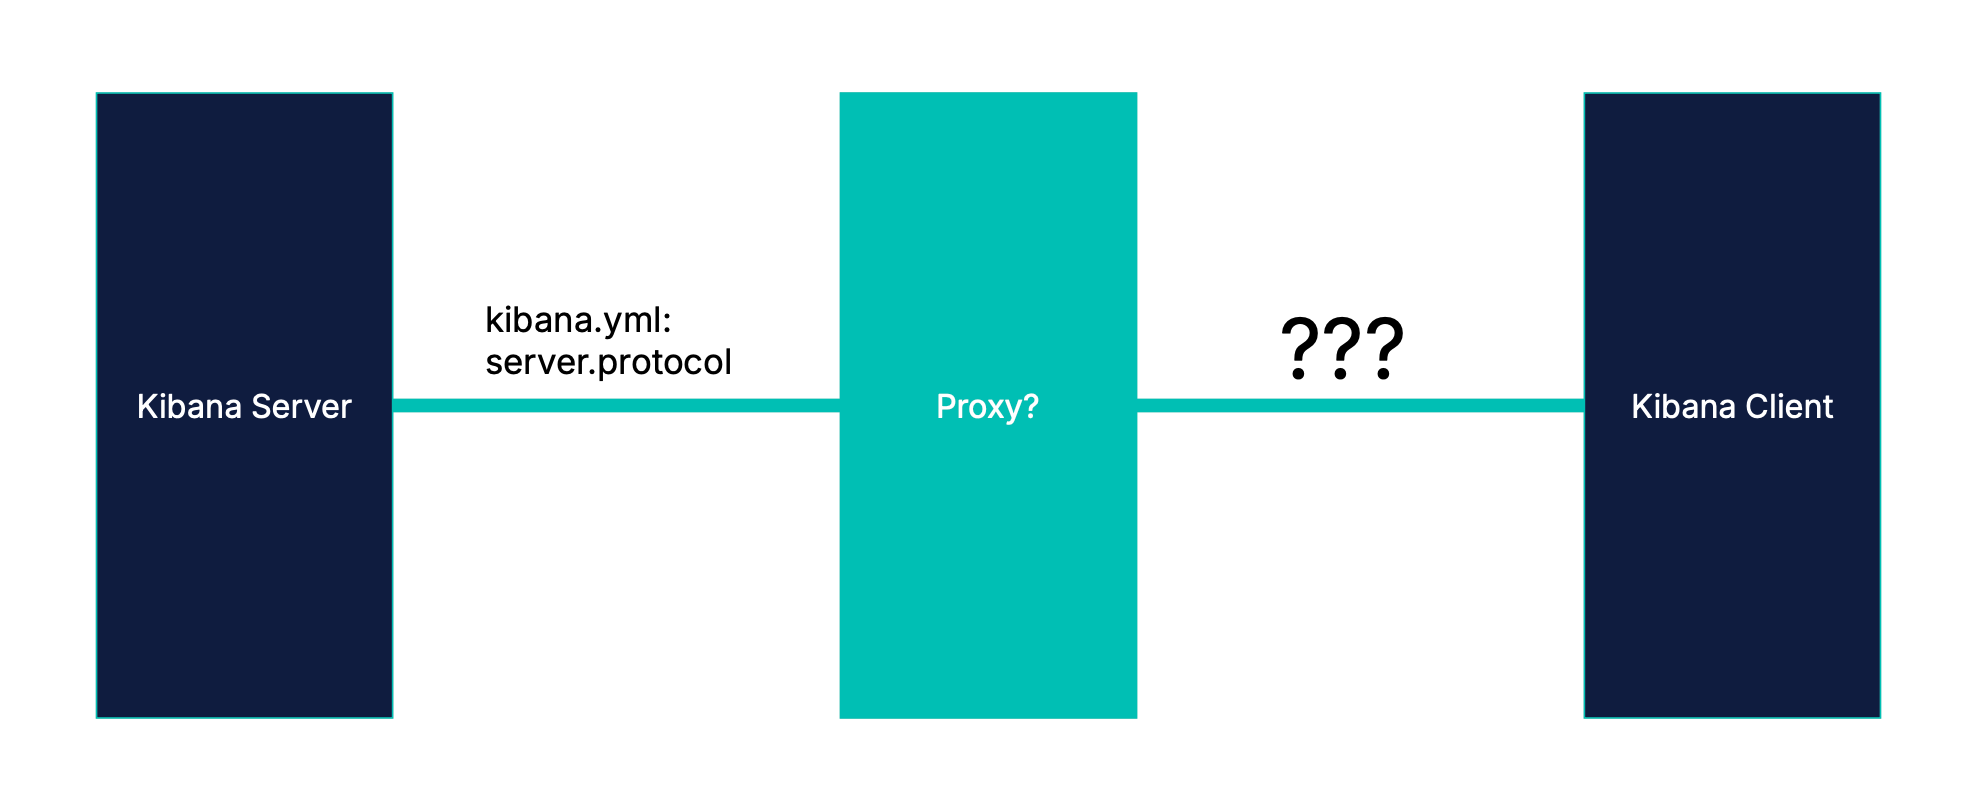
The protocol can differ for each network hop
If we based our optimization on the server protocol, we could get things wrong in one of two ways.
- Apply continuous polling when we shouldn’t and degrade the experience.
- Fail to apply continuous polling when we should and miss out on the optimization.
Luckily, modern browsers provide a way to detect the protocol of the last network hop of any completed request through the use of a PerformanceObserver. So, we watch for the protocol of the first query submission and optimize based on that.
new PerformanceObserver((list) => {
  const entries = list.getEntries();
  const entry = entries.find(({ name }) => name.includes('/internal/search/'));
  if (entry) {
    this.protocolSupportsMultiplexing = ['h2', 'h3'].includes(entry.nextHopProtocol);
  }
});
Lab results: continuous polling vs. traditional polling in Kibana
To validate continuous polling, we created dashboards with query delays ranging from 1 to 23 seconds and measured load times with and without the optimization enabled. We then loaded the dashboards with and without continuous polling to measure the gains (we had a lot of fun with race-for-the-prize).
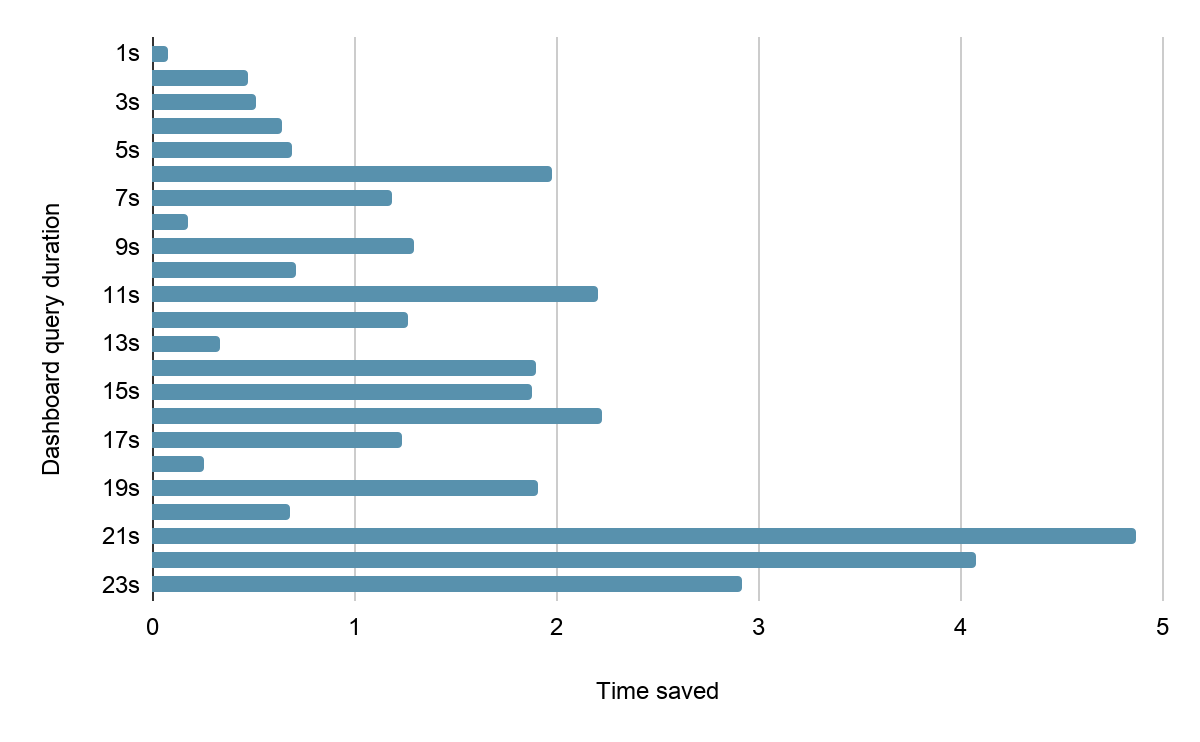
Dashboard load times by query duration
The pattern echoes our original sawtooth diagram. For some query durations, the gains are small while for others they amount to several seconds.
Conclusion
This optimization successfully replaces the latency inherent in traditional polling with a more efficient continuous polling strategy. The primary challenge was implementing this optimization conditionally to prevent performance degradation on HTTP/1 deployments. We solved it using the browser’s PerformanceObserver to reliably detect the protocol in use for the final network hop.
Laboratory testing validates the theory, showing continuous polling delivers results as soon as they are ready. On average, this leads to a meaningful improvement in user experience, making data load up to 25% faster.
This work is the latest step in our commitment to driving down time-to-insight for our users. By making Kibana a more transparent proxy to Elasticsearch data, we push the limits of performance within our sphere of influence. More to come!
(In 2025, Thomas Neirynk gave an excellent overview of the methods and motivation behind improving Kibana dashboard performance. This is an update on that initiative.)
Ready to try this out on your own? Start a free trial.
Want to get Elastic certified? Find out when the next Elasticsearch Engineer training is running!
Related content
May 26, 2026
Kibana dashboards as code: GitOps, drift detection and Terraform for Kibana dashboards in Elastic 9.4
Elastic 9.4 ships a typed Dashboards API and a native Terraform resource that bring drift detection, PR-reviewable diffs and git-based rollback to Kibana dashboards for the first time.
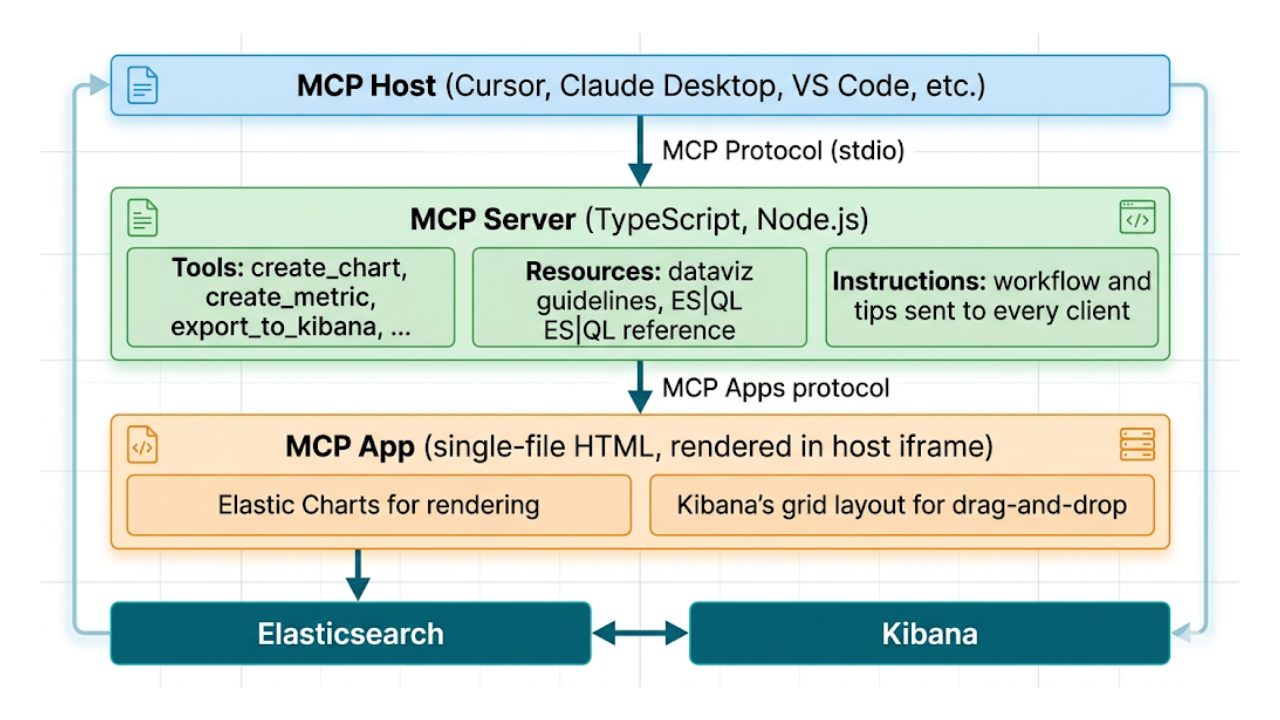
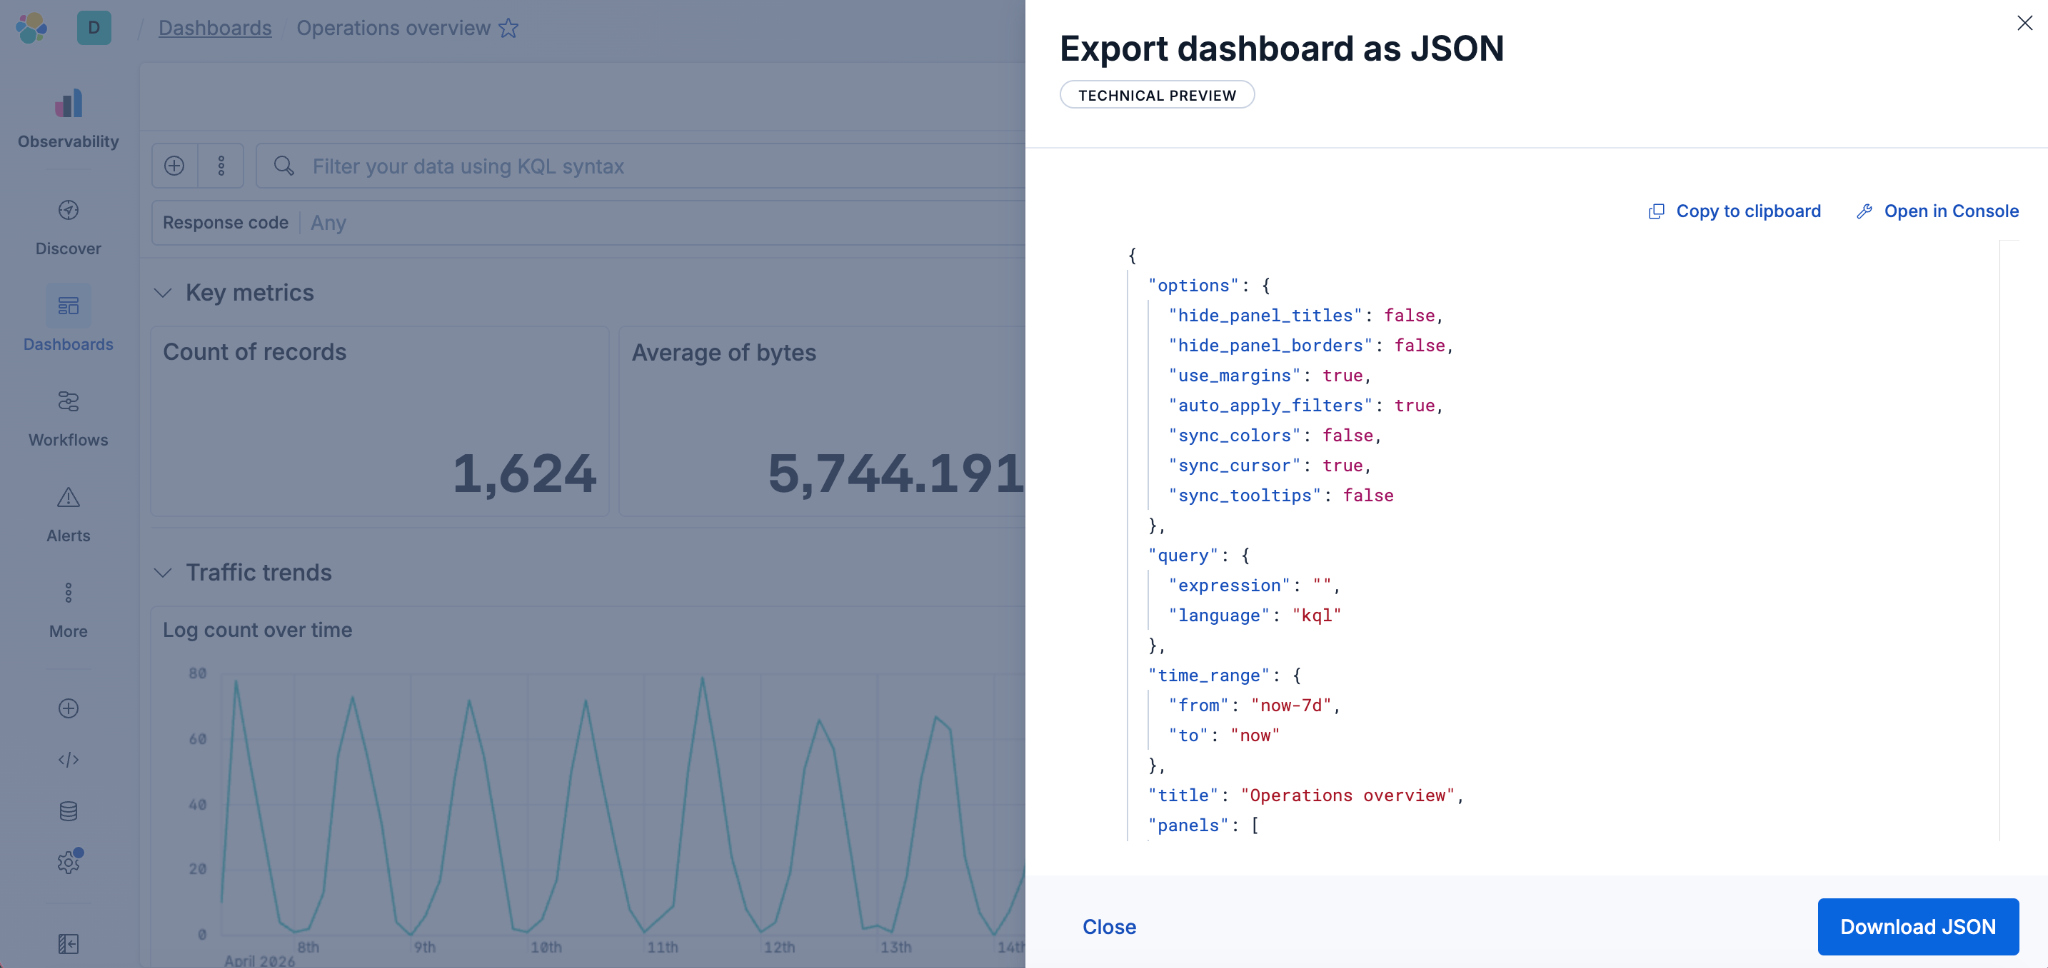
Describe it, don't draw it: AI-native Kibana dashboards via MCP and ES|QL
From prompt to dashboard. Learn how to build Kibana dashboards with natural language, using example-mcp-dashbuilder: an open source MCP application that writes ES|QL queries, creates interactive charts and exports fully functional dashboards directly to Kibana.

May 8, 2026
What’s new in Kibana Dashboards: flexible controls, improved defaults and a visual refresh
Kibana 9.4 ships a batch of dashboard improvements — from better defaults to layout controls to a visual refresh. Here's what changed and why.

May 25, 2026
AI Chat in Kibana now natively renders dashboards
The Elastic AI Chat in Kibana now builds dashboards from natural language, keeping your visuals and analysis in one thread and letting you save them as reusable Kibana objects.

April 28, 2026
Stop guessing which query is burning your cluster: Query activity in Kibana
Pinpoint long-running Elasticsearch searches from Kibana: live tasks, origin context, and cancel when the cluster allows without living in low-level APIs.