Elasticsearch memory requirements
The Elasticsearch process is very memory intensive. Elasticsearch uses a JVM (Java Virtual Machine), and best practices recommend allocating close to 50% of the memory available on a node to the JVM. The JVM relies on memory so that the Lucene process can access index values very fast. The other 50% is left to the file system cache which keeps data that is regularly accessed in memory.
For a full explanation of JVM memory management, read this blog. It is also common to receive warnings from the different types of circuit breakers.
jvm.mem
The most important memory section is the JVM heap.
GET _nodes/stats/jvmThe output looks like this:
"jvm" : {
   	"timestamp" : 1603351829573,
   	"uptime_in_millis" : 150932107,
   	"mem" : {
     	"heap_used_in_bytes" : 258714272,
     	"heap_used_percent" : 24,
     	"heap_committed_in_bytes" : 1073741824,
     	"heap_max_in_bytes" : 1073741824,
     	"non_heap_used_in_bytes" : 192365488,
     	"non_heap_committed_in_bytes" : 209186816,
Note that the heap_used_in_bytes in a healthy JVM will follow a saw tooth pattern due to the garbage collection process, increasing steadily up to around 70%, then reducing sharply to 30% when garbage collection occurs.
The JVM heap_max_in_bytes will depend on the value set in jvm.options file, and you should set it to be 50% of the RAM available for your container or server.
For more information on JVM heap issues, please see: Heap size usage and JVM garbage collection in Elasticsearch.
Explaining the different types of memory statistics
When looking at the memory statistics, we need to be aware that many Elasticsearch applications are running inside containers on much larger machines. This is typical if you are using a hosted service such as AWS Elasticsearch service or Elastic cloud, or if you are running Elasticsearch on Docker or Kubernetes. In such cases, it’s important to be careful to interpret the memory statistics available to us.
There are various memory statistics available from the Elasticsearch monitoring APIs, as explained below:
GET _nodes/stats/os
	"os" : {
   	"timestamp" : 1603350306857,
   	"cpu" : {
     	"percent" : 13,
     	"load_average" : {
       	"1m" : 3.37,
       	"5m" : 3.18,
       	"15m" : 2.8
     	}
   	},
   	"mem" : {
     	"total_in_bytes" : 16703369216,
     	"free_in_bytes" : 361205760,
     	"used_in_bytes" : 16342163456,
     	"free_percent" : 2,
     	"used_percent" : 98
   	},
   	"swap" : {
     	"total_in_bytes" : 1023406080,
     	"free_in_bytes" : 1302528,
     	"used_in_bytes" : 1022103552
   	},
   	"cgroup" : {
     	"cpuacct" : {
       	"control_group" : "/",
       	"usage_nanos" : 2669636420088
     	},
     	"cpu" : {
       	"control_group" : "/",
       	"cfs_period_micros" : 100000,
       	"cfs_quota_micros" : -1,
       	"stat" : {
         	"number_of_elapsed_periods" : 0,
         	"number_of_times_throttled" : 0,
         	"time_throttled_nanos" : 0
       	}
     	},
     	"memory" : {
       	"control_group" : "/",
       	"limit_in_bytes" : "9223372036854771712",
       	"usage_in_bytes" : "4525641728"
     	}
   	}
 	}
The above statistics are for a development node running on Docker. Let’s interpret the sections we received here:
os.mem
The first section “os.mem” refers to the host server where the machine is running. In this case we are running on Docker, so 16GB refers to the memory of the host machine where the container is running. Note that it is quite normal for a machine to be using close to 100% of its memory, and this does not indicate a problem.
os.swap
The “os.swap” section again refers to the host machine. In this case, we can see that the host machine allows swapping. This is quite normal when we are running a container inside a host with swapping still enabled. We can double check that inside the Docker container no swap is permitted by running:
GET _nodes?filter_path=**.mlockallos.cgroup
Finally, we can see the “os.cgroup” section which refers to the container itself. In this case, the container is using 4GB of memory.
process.mem
We also have access to a statistic virtual memory:
GET _nodes/stats/process
 	"process" : {
   	"timestamp" : 1603352751181,
   	"open_file_descriptors" : 436,
   	"max_file_descriptors" : 1048576,
   	"cpu" : {
     	"percent" : 0,
     	"total_in_millis" : 1964850
   	},
   	"mem" : {
     	"total_virtual_in_bytes" : 5035376640
   	}
Note that “process.total_virtual_in_bytes” includes the entire memory available to the process, including virtual memory available via mmap.
Ready to try this out on your own? Start a free trial.
Want to get Elastic certified? Find out when the next Elasticsearch Engineer training is running!
Related content
December 22, 2025
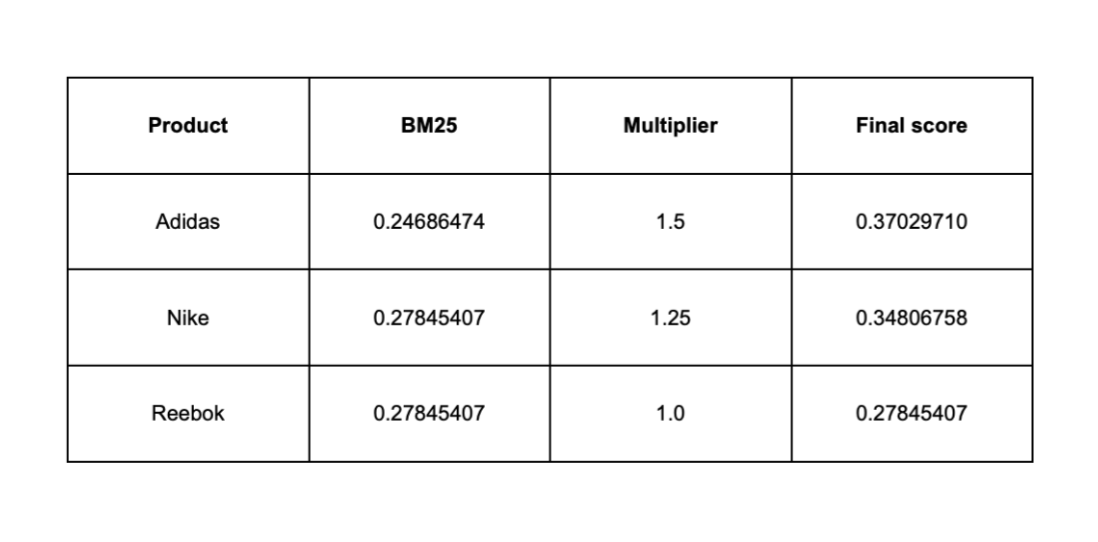
Influencing BM25 ranking with multiplicative boosting in Elasticsearch
Learn why additive boosting methods can destabilize BM25 rankings and how multiplicative scoring provides controlled, scalable ranking influence in Elasticsearch.

December 19, 2025
Elasticsearch Serverless pricing demystified: VCUs and ECUs explained
Learn how Elasticsearch Serverless pricing works for Elastic’s fully-managed deployment offering. We explain VCUs (Search, Ingest, ML) and ECUs, detailing how consumption is based on actual allocated resources, workload complexity, and Search Power.

December 17, 2025
Boosting e-commerce search by profit and popularity with the function score query in Elasticsearch
Discover how to optimize e-commerce search by blending BM25 relevance with profit margin and popularity signals in Elasticsearch using the function_score query.
December 16, 2025
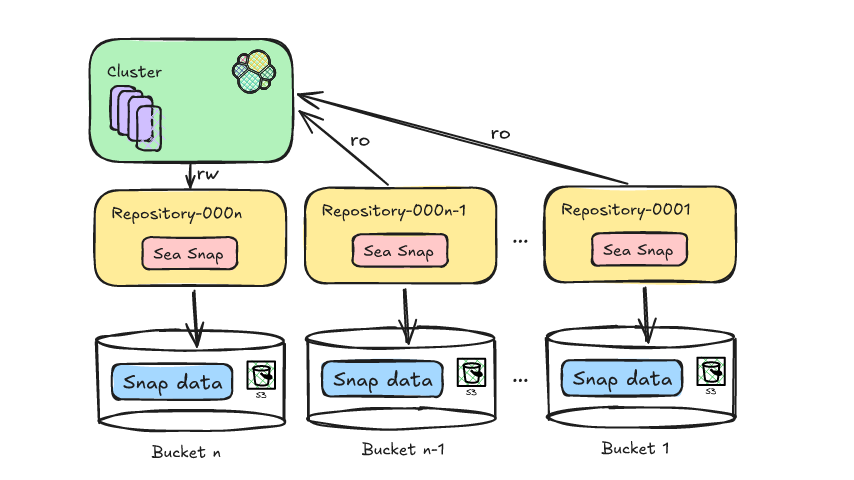
Reducing Elasticsearch frozen tier costs with Deepfreeze S3 Glacier archival
Learn how to leverage Deepfreeze in Elasticsearch to automate searchable snapshot repository rotation, retaining historical data and aging it into lower cost S3 Glacier tiers after index deletion.
December 11, 2025
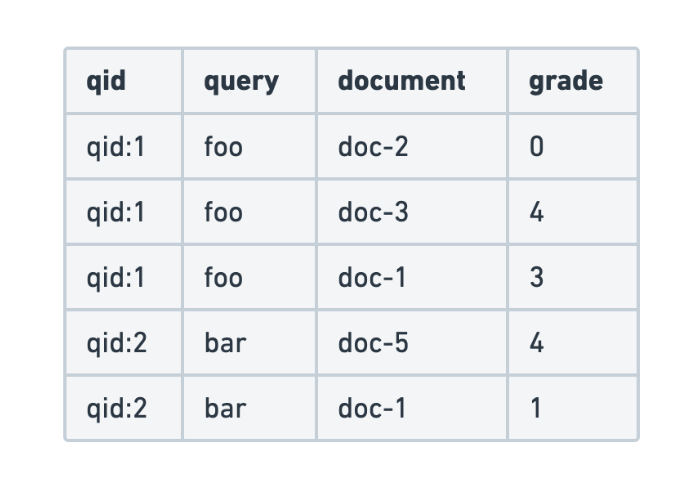
Evaluating search query relevance with judgment lists
Explore how to build judgment lists to objectively evaluate search query relevance and improve performance metrics such as recall, for scalable search testing in Elasticsearch.