There’s no hard size limit in Elasticsearch. Production clusters run at petabyte scale. But "too big" shows up in three ways: queries slow past your Service Level Agreement (SLA), a node hits its shard ceiling, or storage costs spiral because everything lives on the same expensive tier. This guide walks through each signal, the numbers that matter, and what to do about them.
The three limits that actually matter
There’s no hard storage ceiling at the node level. Elastic has demonstrated a single node querying 1 PiB of data. In earlier versions, the per-shard overhead was high enough that the old rule of thumb was no more than 20 shards per GB of heap. Exceeding that limit meant garbage collection pressure, slow cluster state updates, and unstable nodes. Over 7.x and 8.x, a series of optimizations (more compact metadata serialization, efficient caching, off-heap data structures, and compressed cluster state) reduced per-shard overhead to the point where that rule was retired in 8.3, replaced by field-density-based sizing.
What defines your actual ceiling is workload type. Cold nodes at 20 TB with 31 GB of heap handle audit and retention workloads comfortably, because the access pattern is infrequent and aggregation-based. The same spec on a high-concurrency document search workload would struggle.
The three things to watch operationally:
- Shard size: Individual shards that are too large slow queries and recovery.
- Shards per node: Every node has a ceiling, and index lifecycle management (ILM) creates shards automatically whether you track them or not.
- Storage tier mismatch: Keeping data on expensive fast storage longer than needed.
Shard size
Target between 10 GB and 50 GB per shard. The official guidance sets the ILM rollover trigger at 50 GB per primary shard, with 10 GB as the suggested floor. Keep each shard under 200 million documents.
Shards that are too small create unnecessary overhead: more metadata for master nodes, more heap consumed, more network traffic. Shards that are too large slow query execution and make recovery after node failure slow, since Elasticsearch recovers one shard at a time.
One rule you can stop using: The "20 shards per GB of heap" guideline was deprecated in Elasticsearch 8.3. The replacement is simpler: Watch the 1,000 shard-per-node limit below, and keep shard sizes in the 10–50 GB range (or 200M documents).
How to monitor:
# size per shard
GET _cat/shards?&h=index,store&v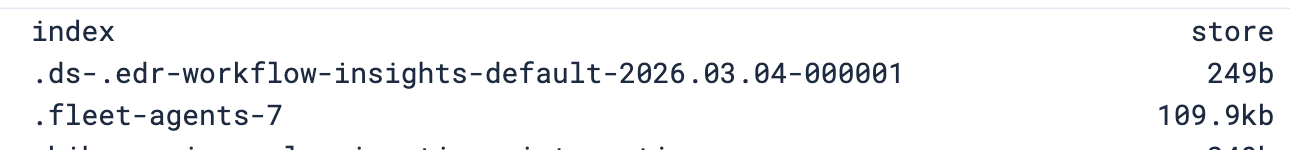
The shard budget
Each non-frozen data node supports up to 1,000 shards. ILM creates shards on your behalf. If your policy rolls over daily with five primary shards and one replica, that’s 10 shards per day. One node fills up in about 100 days without you changing anything.
Options when you’re approaching the ceiling:
- Wider rollover intervals: Roll weekly or monthly if shards are not reaching 50 GB before the time trigger fires.
- Fewer shards per index: For smaller daily volumes, one or two primary shards is often enough. See how to increase primary shard count if you need to rebalance an existing index.
- More nodes: If volume genuinely requires daily rollover at full shard count, distribute across more nodes.
For master nodes, plan for 1 GB of heap per 3,000 indices.
How to monitor:
# shards per node
GET _cat/allocation?h=node,shards&v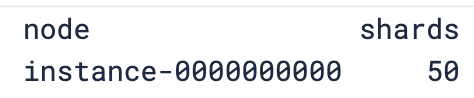
Storage
The search speed guide recommends allocating at least half of system memory to the OS filesystem cache and using directly attached storage. Remote storage generally performs worse. The indexing speed guide echoes this, recommending RAID 0 across multiple local SSDs for write-heavy workloads.
For hot data: Don’t use network-attached storage (NAS). NAS adds latency on every read, and some NAS systems don’t correctly implement POSIX filesystem semantics, which can cause data corruption. Use local SSDs.
What works at each tier:
| Tier | Storage | Why |
|---|---|---|
| Hot | Local SSD (DAS) | High I/O, low latency, safe filesystem semantics |
| Warm | HDD acceptable | Lower query pressure, no active indexing |
| Cold | Searchable snapshots | No replicas needed, ~50% storage savings |
| Frozen | Searchable snapshots | Up to 20x reduction vs warm (Enterprise license) |
How to monitor:
# disk usage per node and role
GET _cat/allocation?h=node,node.role,disk.used,disk.avail,disk.percent&v
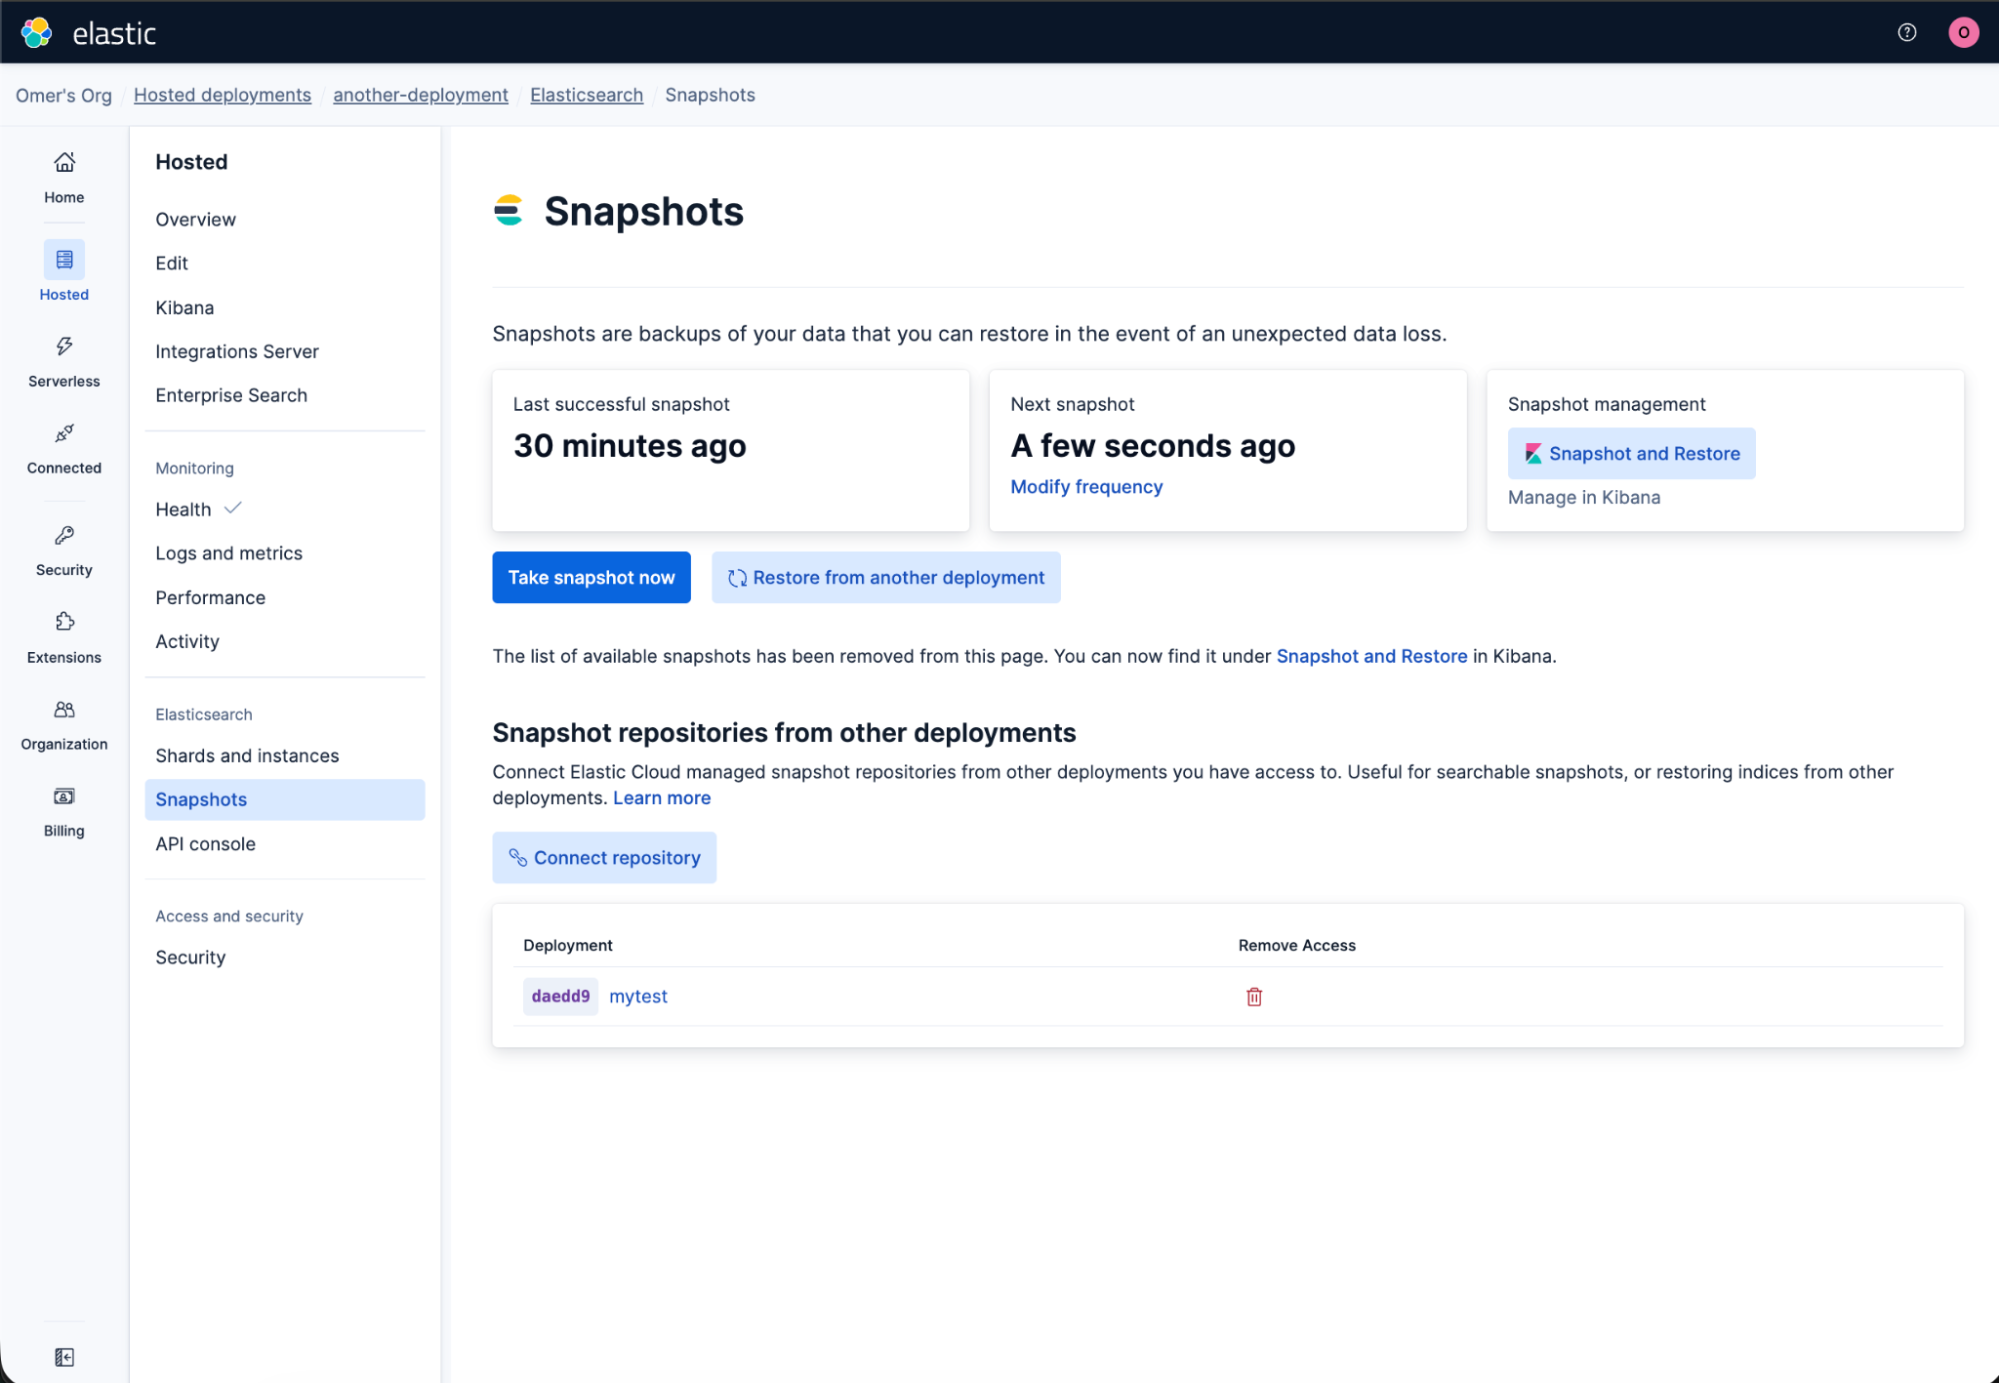
On Elastic Cloud, skip this section. You select a hardware profile per tier, and Elastic handles storage provisioning.
Data tiers and ILM
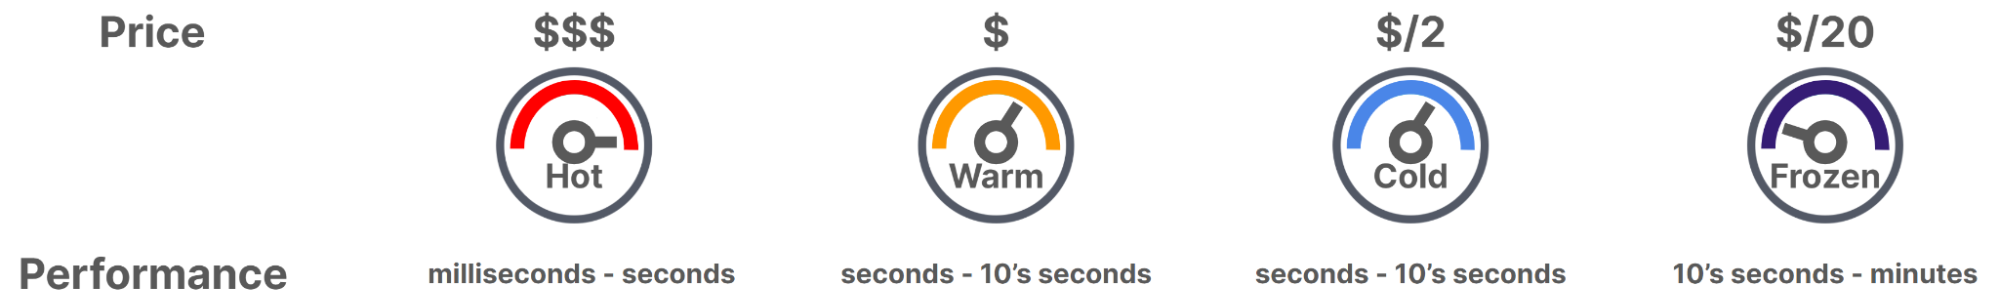
Index lifecycle management moves data through tiers automatically: hot, warm, cold, frozen, delete. The further data moves from hot, the cheaper the storage.
The cold and frozen tiers use searchable snapshots:
- Cold (fully mounted): Performance comparable to a regular index, no replicas required, roughly 50% cheaper than warm.
- Frozen (partially mounted): Up to 20x storage reduction compared to warm, slower queries, requires an Enterprise license.
The cost difference at scale is significant. A Search Labs benchmark measured 90 TB of data: all-hot cost $28,222 per month. A hot+frozen architecture brought that to $3,290 per month.
A typical ILM policy for time-series data with a 14-day hot window:
{
  "policy": {
    "phases": {
      "hot": {
        "actions": {
          "rollover": { "max_primary_shard_size": "50gb" }
        }
      },
      "warm": {
        "min_age": "14d",
        "actions": {
          "shrink": { "number_of_shards": 1 }
        }
      },
      "cold": {
        "min_age": "30d",
        "actions": {
          "searchable_snapshot": {
            "snapshot_repository": "my_repository"
          }
        }
      },
      "frozen": {
        "min_age": "90d",
        "actions": {
          "searchable_snapshot": {
            "snapshot_repository": "my_repository"
          }
        }
      },
      "delete": {
        "min_age": "365d",
        "actions": { "delete": {} }
      }
    }
  }
}
Adjust min_age values to match your query patterns. Data queried weekly can move to cold sooner than data queried daily.
AutoOps
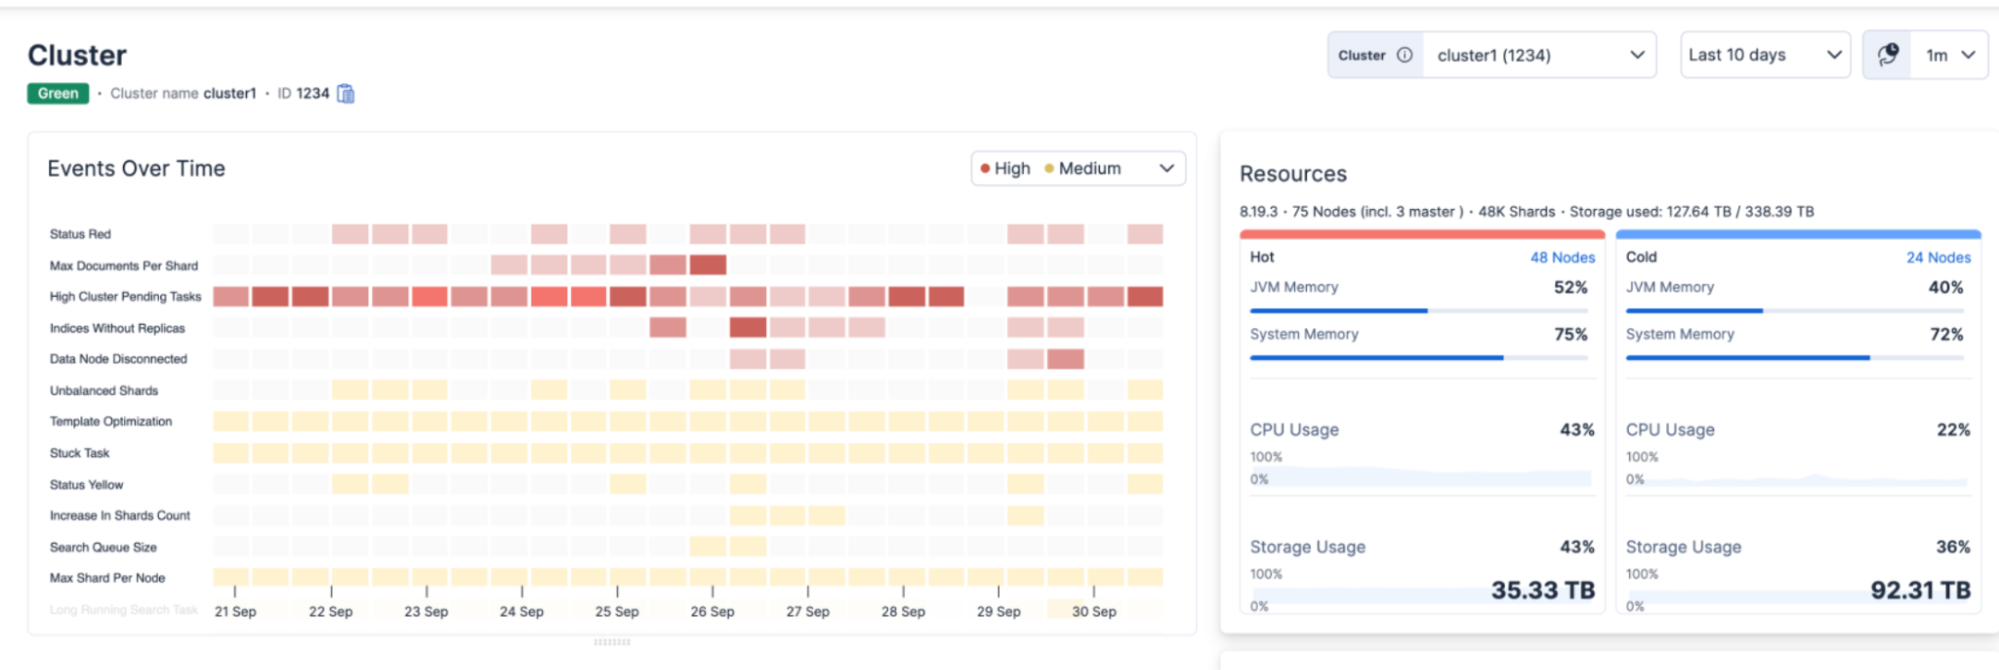
As of February 2026, AutoOps is free for all Elasticsearch users regardless of license tier. On Elastic Cloud, it’s already enabled. For Elastic Self-Managed, Elastic Cloud Enterprise (ECE), and Elastic Cloud on Kubernetes (ECK) deployments, a lightweight Elastic Agent connects your cluster in about five minutes via Cloud Connect. Internet connectivity is required; air-gapped deployments are not supported.
AutoOps samples hundreds of metrics every 10 seconds and surfaces issues with root cause analysis and remediation commands. It does not apply fixes automatically.
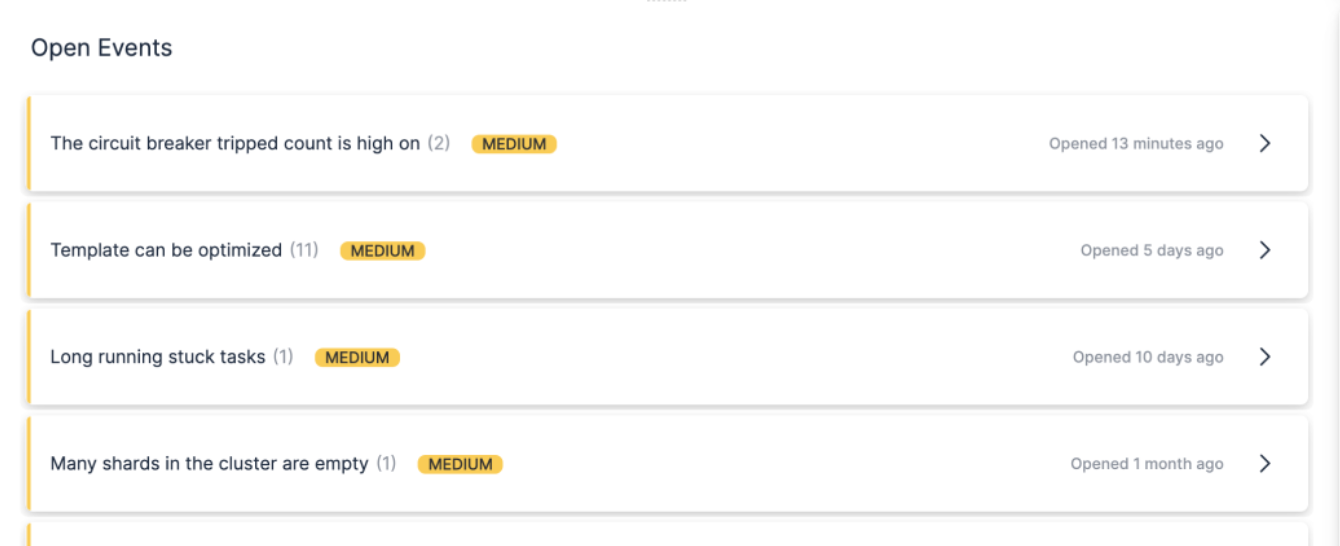
For large deployments it detects:
- Shards growing past the recommended size range.
- Indices without ILM policies that have grown too large.
- Shard imbalance across nodes.
- Disk watermark violations before they cause allocation failures.
- Indexing rejections and ingestion bottlenecks.
- Slow queries and circuit breaker trips from large aggregations.
It ships with 100+ customizable alerts and routes notifications to PagerDuty, Slack, Teams, or any webhook.
Conclusion
Watch shard size (10–50 GB), track your per-node shard budget as ILM rolls, put hot data on local SSDs, and use cold and frozen tiers for data that is rarely queried.
On Elastic Cloud, hardware profiles and AutoOps handle most of this for you. For self-managed deployments, this is your checklist, and AutoOps via Cloud Connect is your early warning system. If you’re unsure how much data your nodes can handle for your specific workload, use Rally to benchmark against your own data before committing to a hardware spec.
Sources
- Size your shards
- Data tiers
- Elasticsearch shards and replicas guide
- How to reduce shard count
- How to increase primary shard count
- Optimize disk space and usage
- Searchable snapshots benchmark
- AutoOps documentation
- Rally: Elastic's benchmarking framework for testing cluster sizing against your own data
- Optimizing storage efficiency in Elasticsearch webinar by Christian Dahlqvist and Alan Woodward
- Using Rally to get your cluster size right: webinar by Christian Dahlqvist and Daniel Mitterdorfer on benchmarking methodology
Ready to try this out on your own? Start a free trial.
Want to get Elastic certified? Find out when the next Elasticsearch Engineer training is running!
Related content
May 29, 2026
One API call per operation: how Elastic Cloud Hosted makes fleet-scale deployment management practical
Elastic Cloud Hosted adds five targeted APIs for upgrade, tier scaling, user settings, tags and snapshot repository linking, each replacing a multi-step deployment plan edit with a single focused call.
May 19, 2026
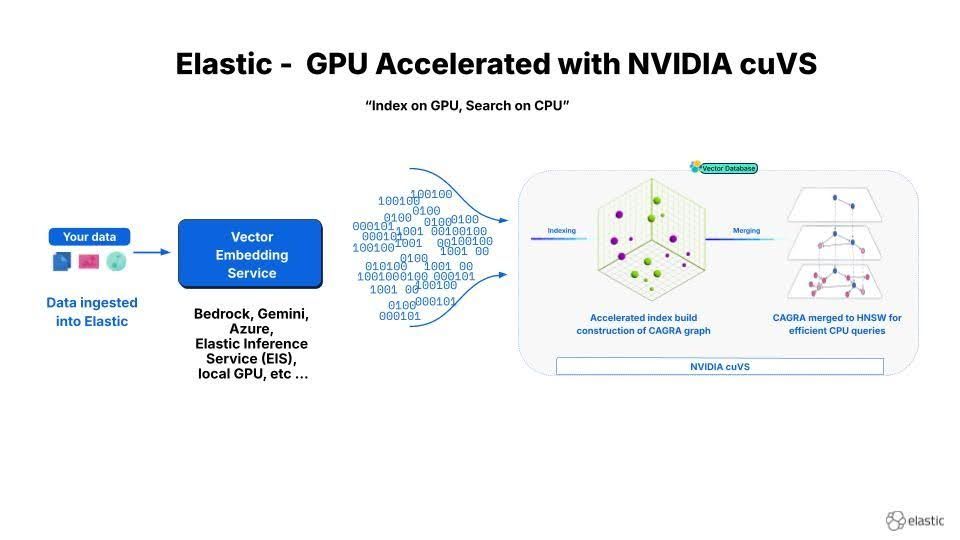
12x faster Elasticsearch vector indexing: deploying NVIDIA cuVS with GPU and CPU tiers
Two patterns for deploying NVIDIA cuVS GPU-accelerated HNSW indexing in Elasticsearch: combined build-and-serve nodes for small clusters and a dedicated GPU ingest tier with ILM handoff to CPU for production at scale.
May 18, 2026
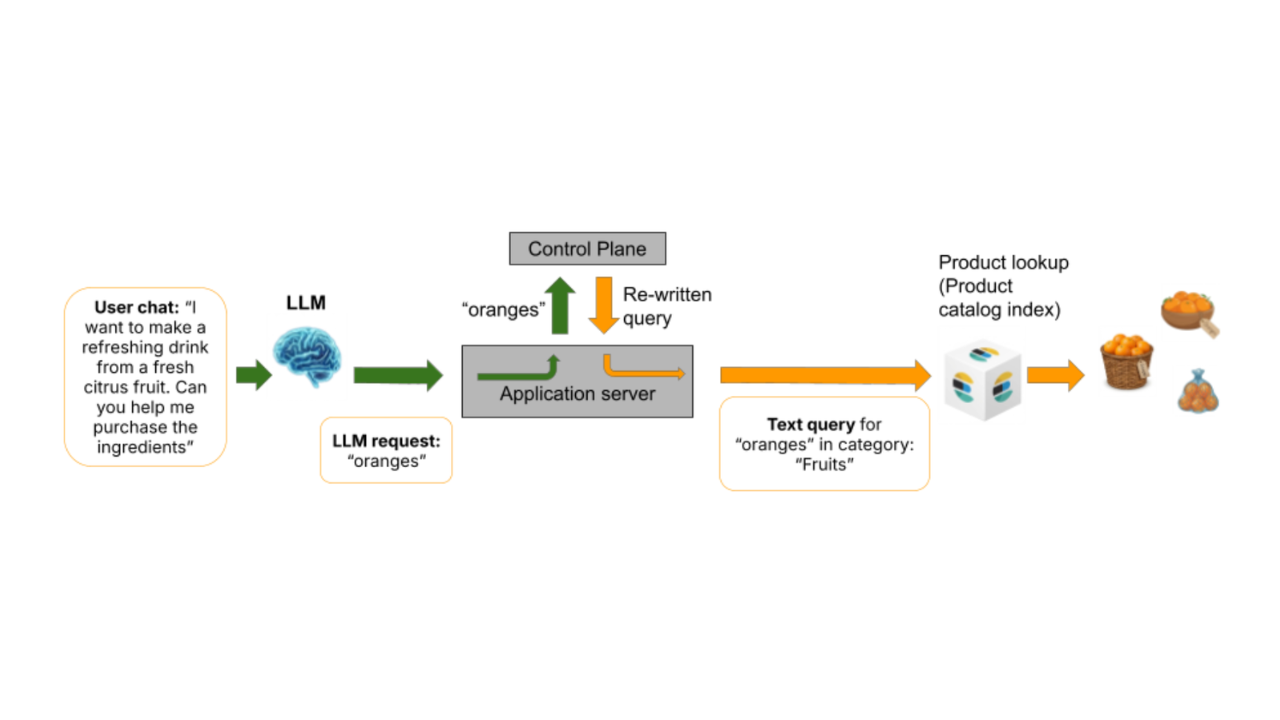
Agentic AI search with deterministic guardrails in Elasticsearch for safe query execution
Agentic AI search systems often fail when LLMs generate queries directly. Learn how deterministic guardrails and a control plane architecture enable safe, reliable, and governed query execution with Elasticsearch.

May 13, 2026
Ecommerce search optimization using margin and popularity boosting in Elasticsearch
Learn how to optimize ecommerce search using margin and popularity boosting. This blog explains how a governed control plane treats economic optimization in Elasticsearch.

May 11, 2026
Personalizing ecommerce search: Integrating purchase history and user cohorts
Learn how to create a personalized ecommerce search experience in Elasticsearch without breaking governance. This post explains how to boost products a shopper has purchased before and how to activate cohort-specific policies based on user profiles.