Point any Prometheus-compatible client at Elasticsearch and run PromQL directly against your existing metrics. Elasticsearch is adding native Prometheus query, discovery, and metadata endpoints as a tech preview that work over metrics ingested through Prometheus Remote Write, OpenTelemetry, or the Bulk API. The API runs on top of Elasticsearch's time series data streams (TSDS), so there's no separate Prometheus-specific storage layer to operate.
This post explains how the query, discovery, and metadata endpoints build on the earlier ingest and query work to form that API surface. Companion posts go deeper on individual pieces:
- Native PromQL support in ES|QL covers how PromQL queries are translated into ES|QL execution plans.
- Ship Prometheus Metrics to Elasticsearch with Remote Write covers ingestion setup.
- How Prometheus Remote Write Ingestion Works in Elasticsearch covers the remote write internals.
This is still a work in progress. The sections below call out what is supported today and which parts are still evolving.
The API surface
Today, the Prometheus-compatible API surface falls into three groups.
Query endpoints
The query endpoints let Prometheus-compatible clients evaluate PromQL expressions:
GET /_prometheus/api/v1/query_rangeevaluates a PromQL expression over a time window (matrix results).GET /_prometheus/api/v1/queryevaluates at a single point in time (vector results). Currently implemented as a short range query that returns the last sample.
Only GET is supported for query endpoints today. Some clients default to POST, so you may need to configure them to use GET. The Prometheus POST convention uses application/x-www-form-urlencoded bodies, which Elasticsearch's HTTP layer rejects as a CSRF safeguard before the request ever reaches the handler.
For the full PromQL coverage status, see the companion post on PromQL in ES|QL.
Metadata endpoints
The metadata endpoints serve the discovery information that clients need for autocomplete, variable dropdowns, and metric browsing.
The series, labels, and label values endpoints all accept match[] selectors and a time range (start/end). The match[] parameter takes a Prometheus series selector like http_requests_total{job="api"} and restricts the response to time series that match. This keeps responses fast and relevant on clusters with large numbers of metrics. For example:
GET /_prometheus/api/v1/series?match[]=http_requests_total{job="api"}GET /_prometheus/api/v1/labels?match[]=http_requests_totalGET /_prometheus/api/v1/label/instance/values?match[]=http_requests_total{job="api"}The first returns all series for http_requests_total where job="api", with their full label sets. The second returns only the label names that exist on http_requests_total series. The third returns only the instance values that appear on matching series.
GET /_prometheus/api/v1/metadata is different: it returns type and unit for each metric, optionally filtered by name via a metric parameter.
GET /_prometheus/api/v1/metadata?metric=http_requests_totalIt does not accept match[] selectors or a time range. In Prometheus, metadata is collected from active scrape targets (the HELP, TYPE, and UNIT lines they expose), so the response does not involve a data scan. Elasticsearch does not have a dedicated metadata store like that, so the current implementation discovers metric metadata by visiting time series data from the last 24 hours. This keeps the query fast without requiring a full index scan. That 24-hour lookback is fixed today: the Prometheus metadata API does not expose start or end parameters that Elasticsearch could use to make it user-adjustable.
How the metadata endpoints work under the hood, including the TS_INFO and METRICS_INFO commands that power them, is covered below.
Index pre-filtering
All query and metadata endpoints accept an optional {index} path segment after /_prometheus/:
GET /_prometheus/metrics-prod-*/api/v1/query_range?query=up&start=...&end=...This restricts which Elasticsearch indices the query runs against before any expression evaluation begins. On clusters with many data streams across teams or environments, this avoids scanning unrelated indices and can significantly reduce query latency. You can configure separate data sources per index pattern to give teams scoped access to their own metrics.
A note about Remote Write
For ingestion, Elasticsearch also exposes the standard Prometheus Remote Write endpoint:
POST /_prometheus/api/v1/writeingests time series via the Prometheus Remote Write v1 protocol. v2 is not yet supported.
Remote Write writes into Elasticsearch's existing time series data streams (TSDS), not a separate Prometheus-specific storage layer. Prometheus labels become TSDS dimensions, and metric names become fields in the index mapping. The remote write architecture post covers the full mapping in detail, including how metric types are inferred and how labels are stored with a labels. prefix.
How it works
Under the hood, all endpoints work the same way: parse the incoming HTTP parameters, build an ES|QL query plan, execute it against time series data streams, and convert the columnar result back into the JSON format Prometheus clients expect.
TS_INFO and METRICS_INFO
The metadata endpoints need to answer questions like "what labels exist?" or "what metric types are defined?" across potentially millions of time series, without scanning every data point.
Internally, the Prometheus metadata endpoints answer those questions by building ES|QL plans around two new processing commands: METRICS_INFO and TS_INFO. You do not need to use these commands directly to use the Prometheus API, but they are the core execution primitives behind the metadata responses. Both work by visiting only one document per time series to extract its metadata, rather than scanning all samples. This means their cost scales with the number of distinct time series, not the number of data points.
METRICS_INFO returns one row per distinct metric with its name, type, unit, and associated dimension fields. TS_INFO is more granular: one row per (metric, time series) combination, including the actual dimension values as a JSON object.
TS metrics-*
| METRICS_INFO
| SORT metric_name
A dedicated blog post on TS_INFO and METRICS_INFO is coming soon, covering the two-phase execution model, how they scale, and how to use them directly in ES|QL queries beyond the Prometheus API.
How the metadata endpoints use them
Each metadata endpoint constructs an ES|QL plan with one of these commands at its core.
/api/v1/labels and /api/v1/series use TS_INFO, since they need per-time-series detail (which labels exist, which dimension values identify each series). /api/v1/metadata and /api/v1/label/__name__/values use METRICS_INFO, since they only need per-metric information (metric names, types, units).
/api/v1/label/{name}/values for regular labels (anything other than __name__) does not use either command. Regular labels like job or instance are actual dimension fields in the index, so the endpoint can query them directly with a group-by aggregation. When match[] selectors are provided, they are translated into a WHERE clause that filters the time series before the aggregation runs.
The __name__ label needs a different strategy because it is not always present as a dimension field. Prometheus Remote Write does store labels.__name__, but metrics ingested through other paths (OpenTelemetry, the bulk API) do not have it. The metric name is encoded in the field name itself (e.g., metrics.http_requests_total). You could look at the index mappings to enumerate field names, but mappings alone do not tell you which metric has which dimensions, and they cannot be filtered by label values from a match[] selector. METRICS_INFO can do both: it enumerates metric names across indices while respecting upstream WHERE filters.
In all cases, the API layer handles the translation back to Prometheus conventions: stripping the labels. and metrics. storage prefixes and synthesizing __name__ for non-Prometheus metrics that lack it.
In conclusion
The result: any Prometheus-compatible client can query and explore Elasticsearch metrics through endpoints it already understands. Remote Write metrics, OpenTelemetry metrics, and metrics indexed through other paths all show up through the same API, backed by the same TSDS indices.
All the Prometheus APIs mentioned here are available as tech preview in Elasticsearch Serverless today. For self-managed clusters and Elastic Cloud Hosted deployments, available as tech preview in Elasticsearch 9.4, with the exception of GET /_prometheus/api/v1/metadata. To experiment locally, use start-local.
Ready to try this out on your own? Start a free trial.
Elasticsearch has integrations for tools from LangChain, Cohere and more. Join our advanced semantic search webinar to build your next GenAI app!
Related content
May 26, 2026
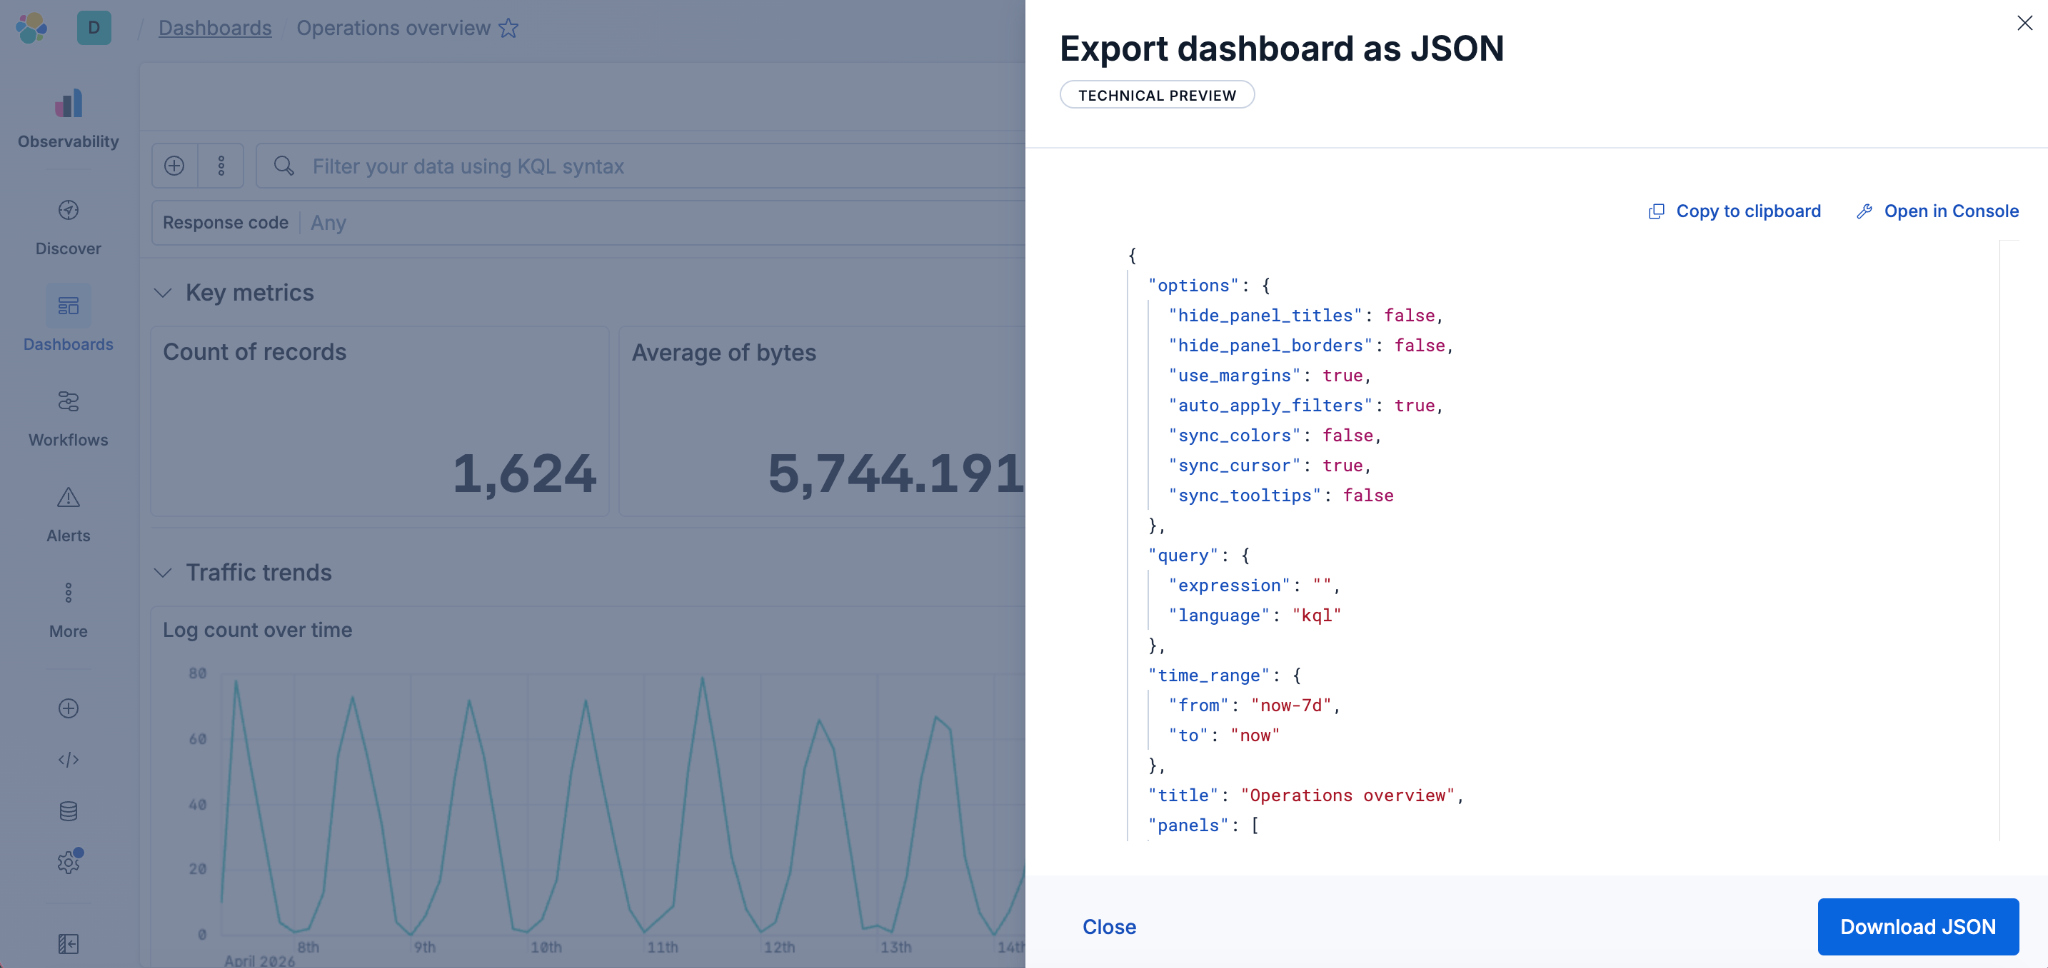
Kibana dashboards as code: GitOps, drift detection and Terraform for Kibana dashboards in Elastic 9.4
Elastic 9.4 ships a typed Dashboards API and a native Terraform resource that bring drift detection, PR-reviewable diffs and git-based rollback to Kibana dashboards for the first time.
May 19, 2026
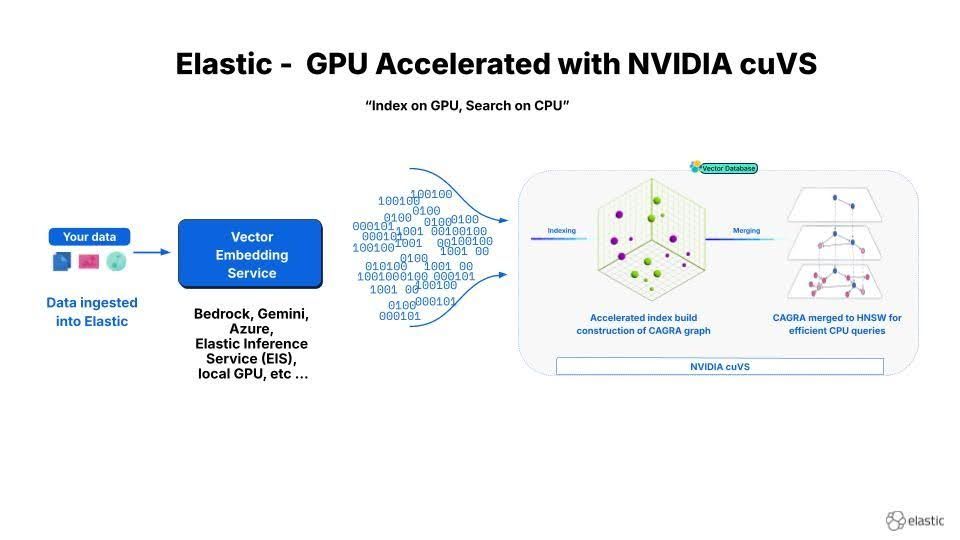
12x faster Elasticsearch vector indexing: deploying NVIDIA cuVS with GPU and CPU tiers
Two patterns for deploying NVIDIA cuVS GPU-accelerated HNSW indexing in Elasticsearch: combined build-and-serve nodes for small clusters and a dedicated GPU ingest tier with ILM handoff to CPU for production at scale.

March 23, 2026
Using Elasticsearch Inference API along with Hugging Face models
Learn how to connect Elasticsearch to Hugging Face models using inference endpoints, and build a multilingual blog recommendation system with semantic search and chat completions.
March 27, 2026
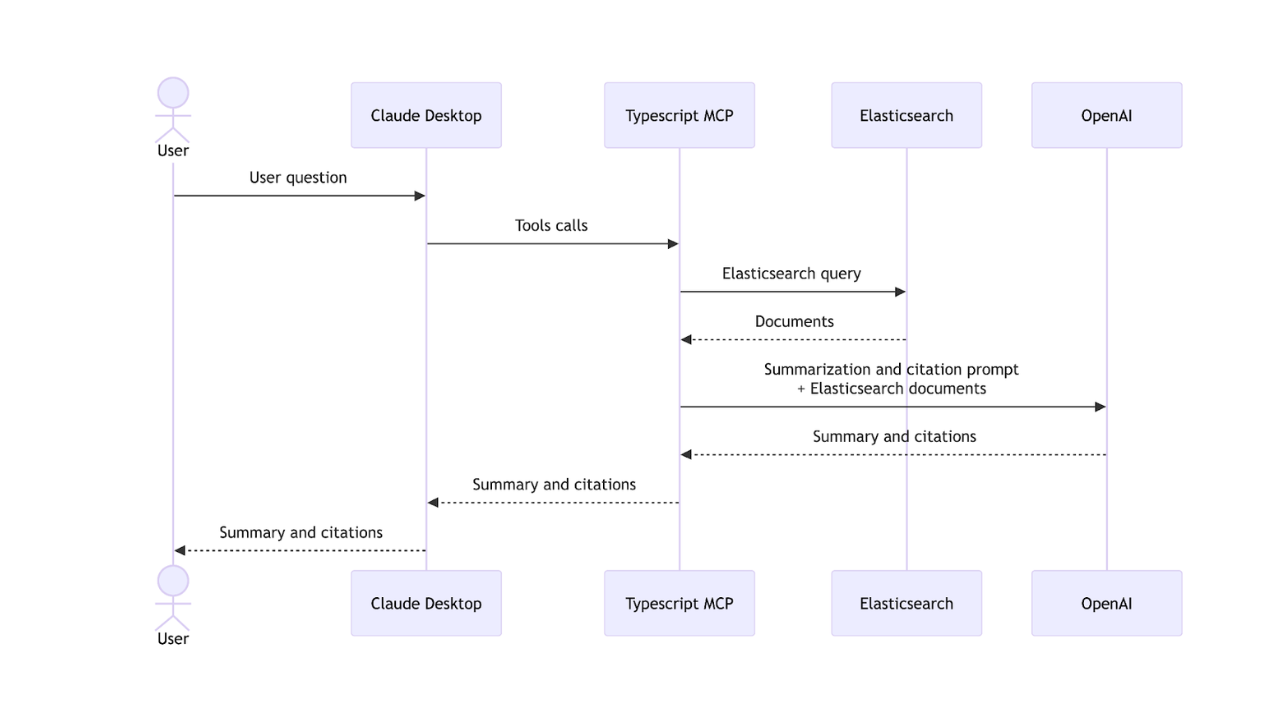
Creating an Elasticsearch MCP server with TypeScript
Learn how to create an Elasticsearch MCP server with TypeScript and Claude Desktop.
March 17, 2026
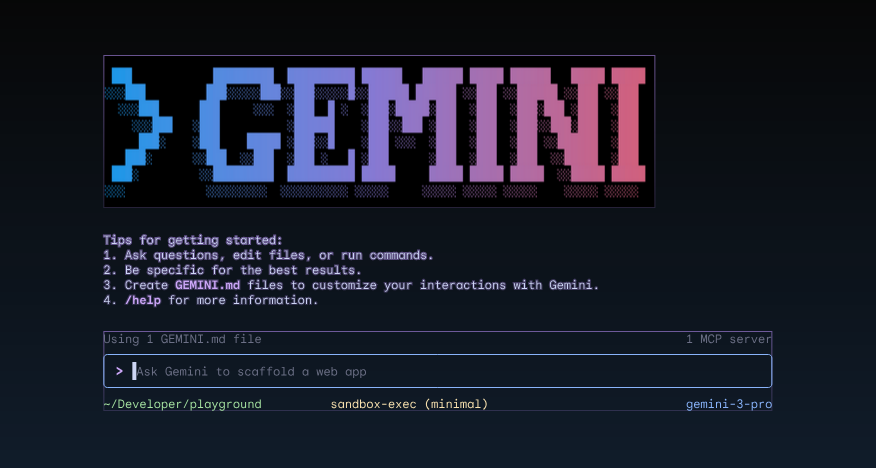
The Gemini CLI extension for Elasticsearch with tools and skills
Introducing Elastic’s extension for Google's Gemini CLI to search, retrieve, and analyze Elasticsearch data in developer and agentic workflows.